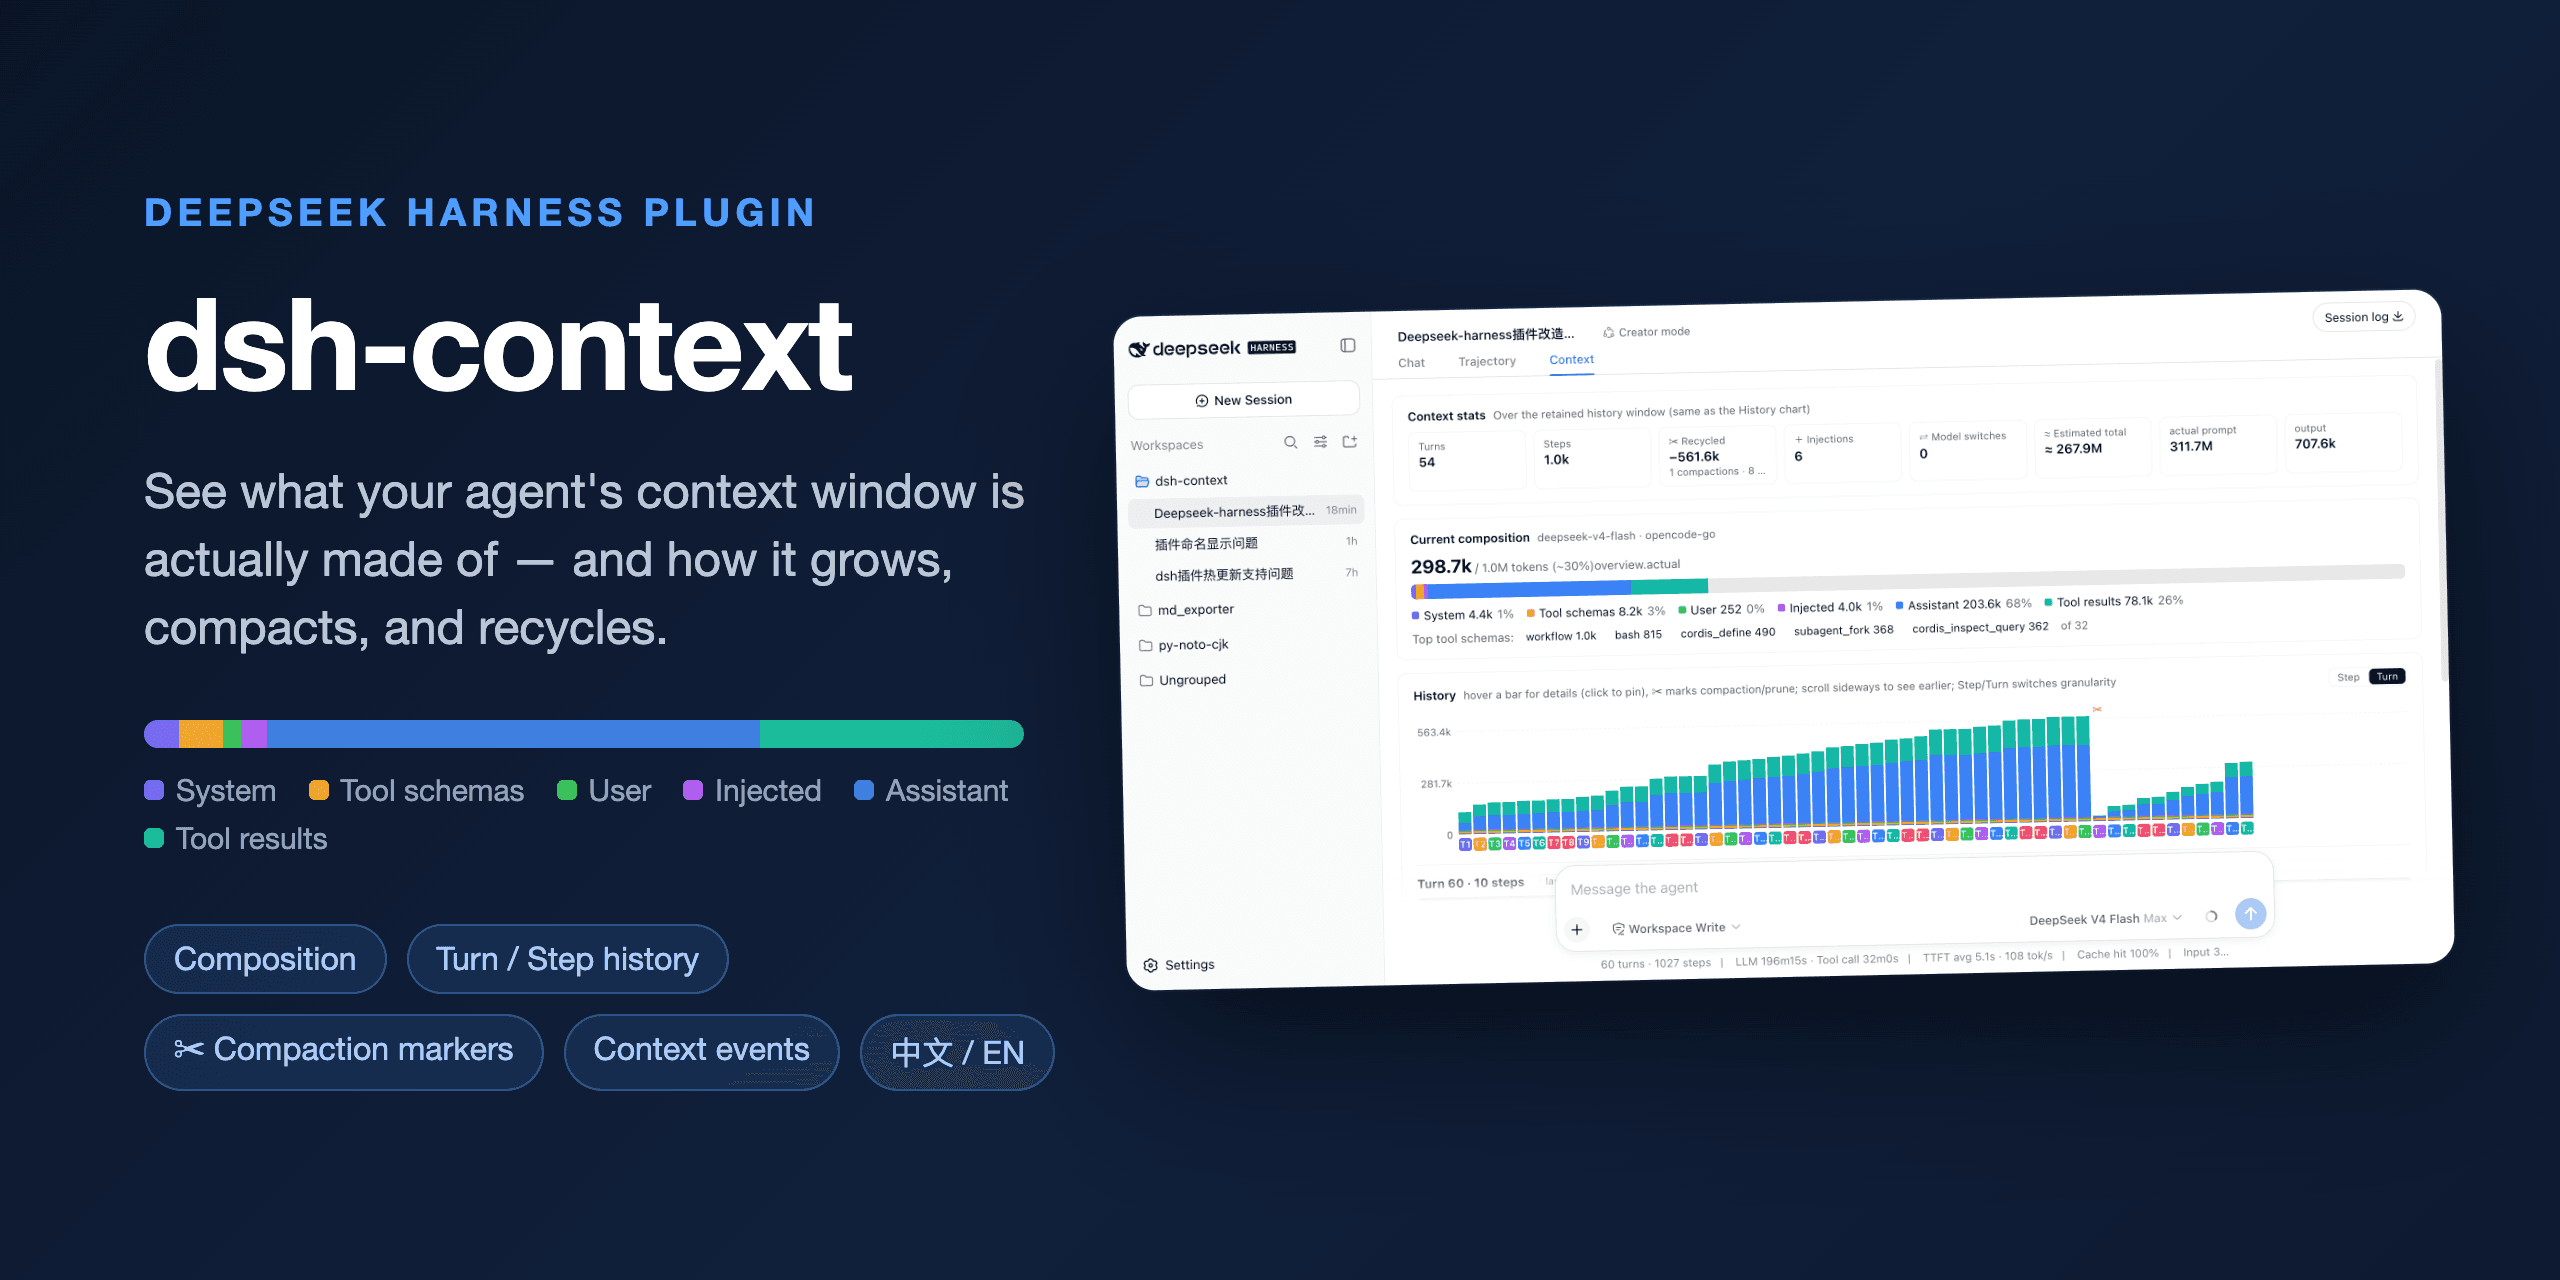
Add a "Context" panel and /context popup to DeepSeek Harness, displaying current window composition, historical token trends, compression and pruning events, giving users visibility into how much context the model consumes.

- Language
- TypeScript
- License
- Apache-2.0
- Branch
- main
Install
$ dsh plugin --profile web add dsh-contextRun the command above in your terminal to install this plugin via the dsh CLI. You can switch Profile in the top-right corner. New to dsh? Read the beginner tutorial
Install via your agent
Install the DeepSeek Harness plugin bowenliang123/dsh-context for me: review the repository at https://github.com/bowenliang123/dsh-context first, then run the install command and verify the plugin loads successfully.
Paste this instruction to the DSH Web GUI assistant — it will install and verify for you.
One-Line Description
dsh-context adds a "Context" panel and /context popup to DeepSeek Harness's Web session view, visualizing the token composition of the model's current visible window, historical changes, and compression/pruning records through stacked bars, trend curves, and event lists—so you can see at a glance "what's eating up the context".
Core Features
- Inject "Context" tab: Insert a Context tab at order 20 in the session view, positioned after Chat (order 0) and Trajectory (order 10), displayed alongside official panels
- Provide
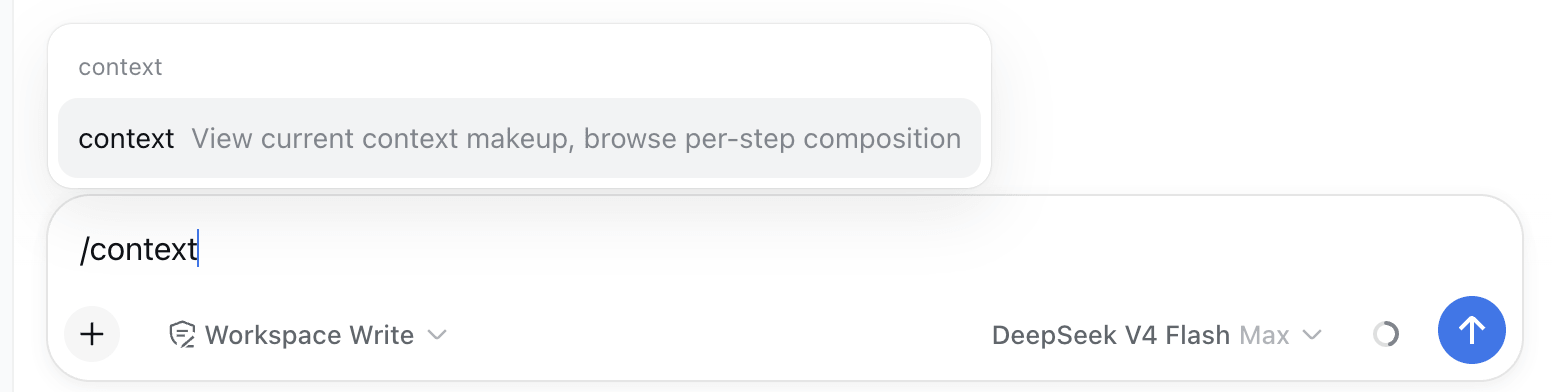
/contextslash command: Type in the input box or select from the/menu to pop up a centered dialog showing current composition headline + six types of stacked bars + compact trend chart for the last 10 turns - Real-time display of current window composition: Token percentages for six categories—system prompts / tool definitions / user messages / injected context / assistant replies / tool results—plus remaining capacity relative to the model's full context window
- Show historical token trends: One stacked bar per model request, switchable between Turn / Step granularity, hover for details, click to pin a complete breakdown of a single request
- List context change events: Four event types—compression, tool result pruning, skill/plugin injection, model switching—filterable by category, annotated with token increase/decrease for each event
- Expose model's actual visible message list: Complete message list the model can see in the current session, sorted by token cost from highest to lowest
Technical Implementation
- Language: TypeScript (both host half and client half compiled from src/)
- Key dependencies:
zod(runtime validation + projection schema),@deepseek-ai/dsh-session-projection(host registers projection unit),@deepseek-ai/dsh-token-meter(readscontextPressureprojection as anchor),@deepseek-ai/dsh-client-ui-primitives(shared UI icons) - Architecture pattern: Dual-sided plugin — Host half registers as a cordis plugin in
cordis.patch.yml, registers a projection unit namedcontextTimelineto harness'sctx.sessionProjections(init/apply/view, stateVersion=2), driven event-by-event by harness to fold and push results through the session projection pipeline to the browser; Client half is bundled as a CJS closure factory injected into the browser via the package'sdsh.clientdeclaration, reads data from the standarduseProjection('contextTimeline')seat, no custom RPC involved - Entry files: Host
src/host/index.ts(cordis entry, registers projection unit to sessionProjections), Clientsrc/client/index.ts(registers session view tab and/contextcommand), build byscripts/build.mjsproducinglib/index.js(host, ESM) andlib/client.js(client,window.__ModuleLoader__.loadclosure)
Use Cases
When DeepSeek Harness sessions become long, models start "forgetting" early content, compression and pruning happen frequently, but users have no way to know whether it's system prompt bloat, heavy tool schemas, or tool results filling the window—this plugin's visualization panel shows how many tokens each content type occupies and how much space compression/pruning recovered. The compact popup for the last 10 turns is perfect for quickly checking /context during long-running tasks without shifting the current input focus.
Prerequisites & Compatibility
| Dependency | Min Version | Description |
|---|---|---|
| DeepSeek Harness | 0.1.0-rc.6+ (all devDependencies locked to 0.1.0-rc.6; no peerDependencies declared in package) | Both client and host depend on session-projection registry and token-meter introduced in 0.1.0-rc.6 |
| Node.js | Not declared | Build script uses esbuild + Node ESM, runtime is managed by host |
| Platform | macOS / Windows / Linux | Cross-platform, no native modules, no specific OS restrictions |
| Native modules | None | zod is the only runtime dependency, pure JS |
Installation
dsh plugin --profile web add github:bowenliang123/dsh-context
Configuration Options
| Config | Type | Description | Default |
|---|---|---|---|
maxRequestSteps | Integer | Maximum historical step (single model call) records to keep per session; beyond this, pruning by full turns, never half-turns | 1500 |
maxKeptTurns | Integer | Number of recent full turns to keep; once session exceeds this limit, folder immediately prunes to the most recent N turns | 300 |
maxEvents | Integer | Maximum recent context events (compression/pruning/injection/switching) to retain | 400 |
maxNodes | Integer | Maximum "model visible message nodes" pushed to browser; newer nodes overwrite older ones | 200 |
These fields correspond to the
config:block of the dsh-context loader row incordis.patch.yml; zod validates strictly, incorrect or unknown fields will cause plugin load failure. Other fields are maintained by the plugin itself and generally don't need modification during deployment.
FAQ
Q: Does this plugin modify session history or inject extra content into prompts?
A: No. The host half folds session event streams into view state but doesn't write back any new events; the /context command is client-triggered and doesn't write to session/events during triggering, so one /context won't become model input.
Q: What's the difference between the /context command and the right-side Context tab?
A: The data is identical. The command popup is a condensed version of the tab: it only renders the current composition headline, six stacked bars, and compact trend chart for the last 10 turns; the tab adds full historical curves, compression/pruning event stream, current model's visible message list, and session stats card.
Q: What if the "Context" tab doesn't appear on the right after installation?
A: This plugin only works for web profile (dsh.client.platform=web in package.json). Please confirm the installation command included --profile web and use dsh web to start the frontend; CLI / TUI / other clients won't show the tab.
Q: Why does typing /context in the input box have no response?
A: /context is a soft dependency on harness's inputTriggers service. If the current DSH version doesn't have this service, the tab will work normally but there's no trigger menu; please upgrade DSH to 0.1.0-rc.6 or higher.
Q: How many recent turns / steps are retained? Will data be lost?
A: Default 1500 steps / 300 turns / 400 events / 200 model visible message nodes. The folder only prunes full turns, never cuts a turn in half; these are adjustable fields in the cordis config, not the underlying session logs themselves.
Q: Will uninstalling the plugin lose my accumulated context view data?
A: Yes. The context projection state is folded by the plugin itself and doesn't persist to a DSH external layer; after uninstall or disable, reinstalling requires the session to regenerate events to rebuild the view. The session's original events are still preserved in harness and unaffected.
Q: Where does the "model remaining available window" number at the top come from?
A: Since 0.11, this number comes from DSH official token-meter's exposed contextPressure projection (provider actual usage + heuristic estimate). If token-meter is not installed or that projection doesn't exist, it automatically falls back to this plugin's surface-based message estimate.
Q: Do I need internet or configure an API key?
A: No. zod is the only runtime dependency, all token estimation is done locally; only the "plugin info" card makes one version check request to npm registry (1-hour cache), offline or CSP-blocked will gracefully degrade without showing upgrade hints.
Learning Curve
Beginner — install it and the Context tab and /context command appear on the right; no additional configuration needed; understanding cordis config block structure is only required if you want to adjust historical window length.
Known Issues & Limitations
- Both client and host depend on session-projection registry and token-meter
contextPressureprojection introduced in 0.1.0-rc.6; earlier DSH versions may not see the tab or read the anchor number - Projection state
stateVersion: 2, after host upgrades to 0.11 the old clientoccupancyfield is marked as LEGACY — clients should read token-meter projection instead, otherwise only see compatibility fields latestVersioncheck goes to https://registry.npmjs.org/dsh-context/latest, strict corporate intranet/CSP policies may block it, but failure degrades silently without affecting core functionality/contextcommand depends on harness'sinputTriggersservice; in hosts without this service the tab still works but command will be ineffective- Context projection state is not persisted by the plugin, after uninstall need to wait for session to regenerate events before view can be rebuilt
dsh-context


The best DeepSeek Harness plugin for Agent's context insights and management.
dsh-context provides full context lifecycle management features.
- Context tab — an UI context dashboard for DeepSeek Harness’s context stats, composition, history, events, and messages.
/contextcommand — the slash command shows the context model for current context composition and recent context evolution.
Install / Update
To Install from any DeepSeek Harness installation:
dsh plugin --profile web add dsh-context
Or to update the dsh-context plugin:
dsh plugin --profile web update dsh-context@latest
Then start the web UI with dsh web. No build step, no restart.
Use it
Context tab
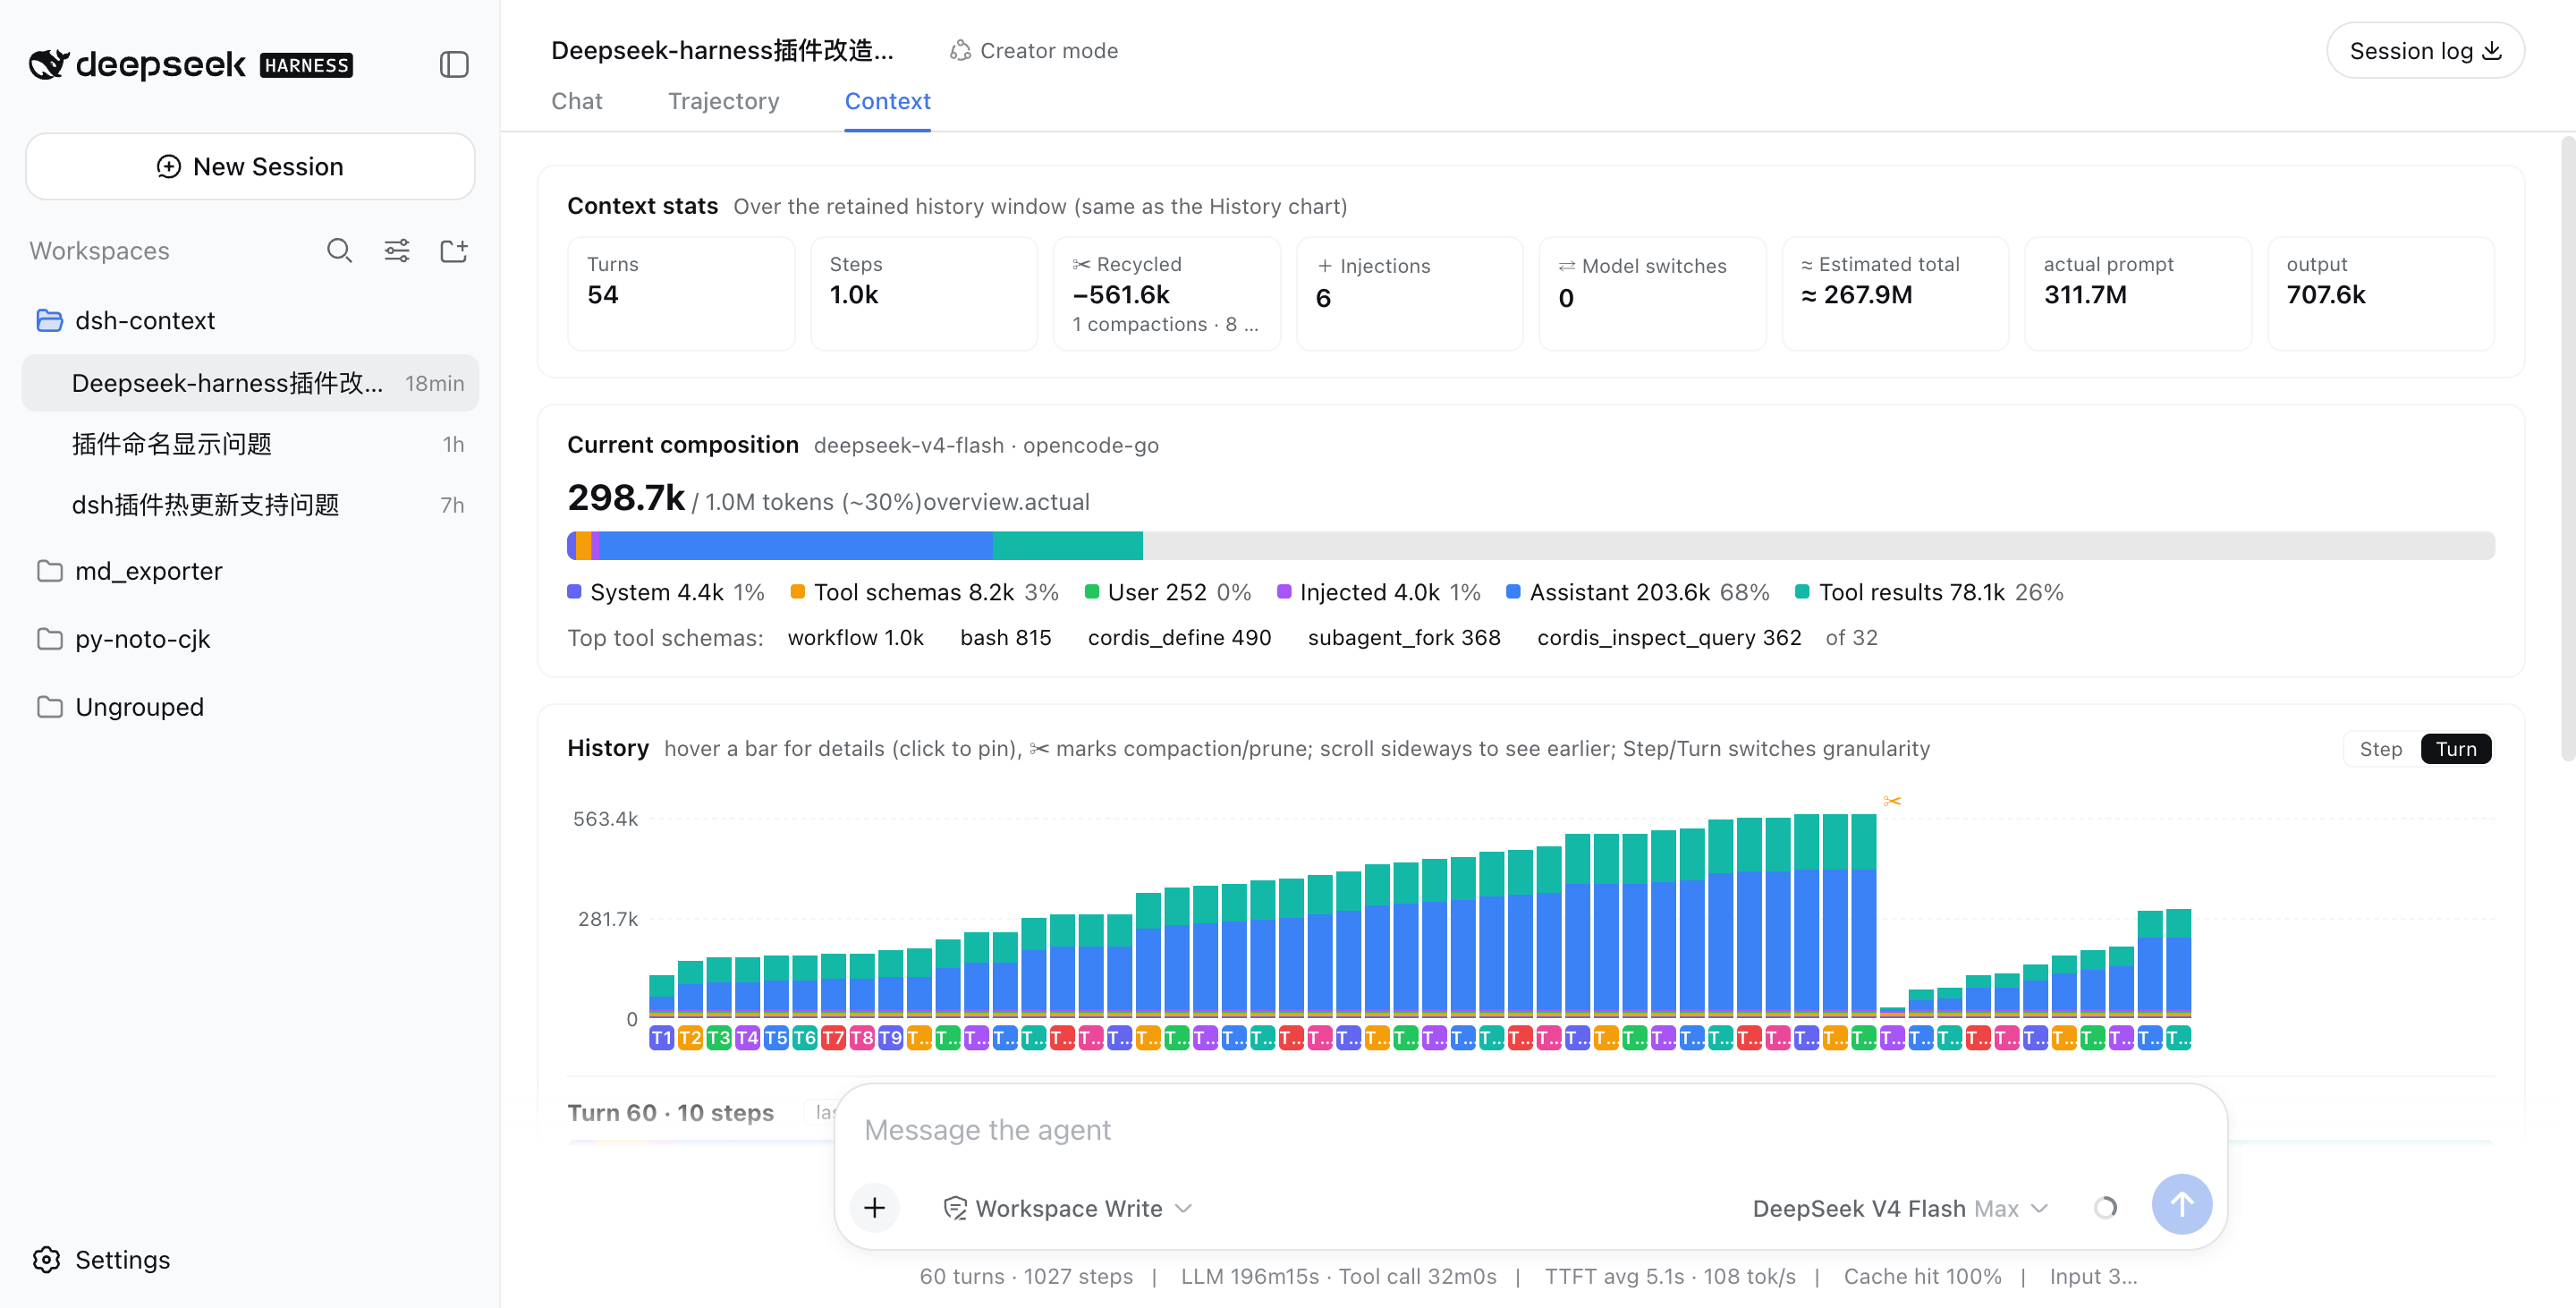
Open any session and click the Context / 上下文 tab:
⌨️ /context command — In-session Context Insight modal
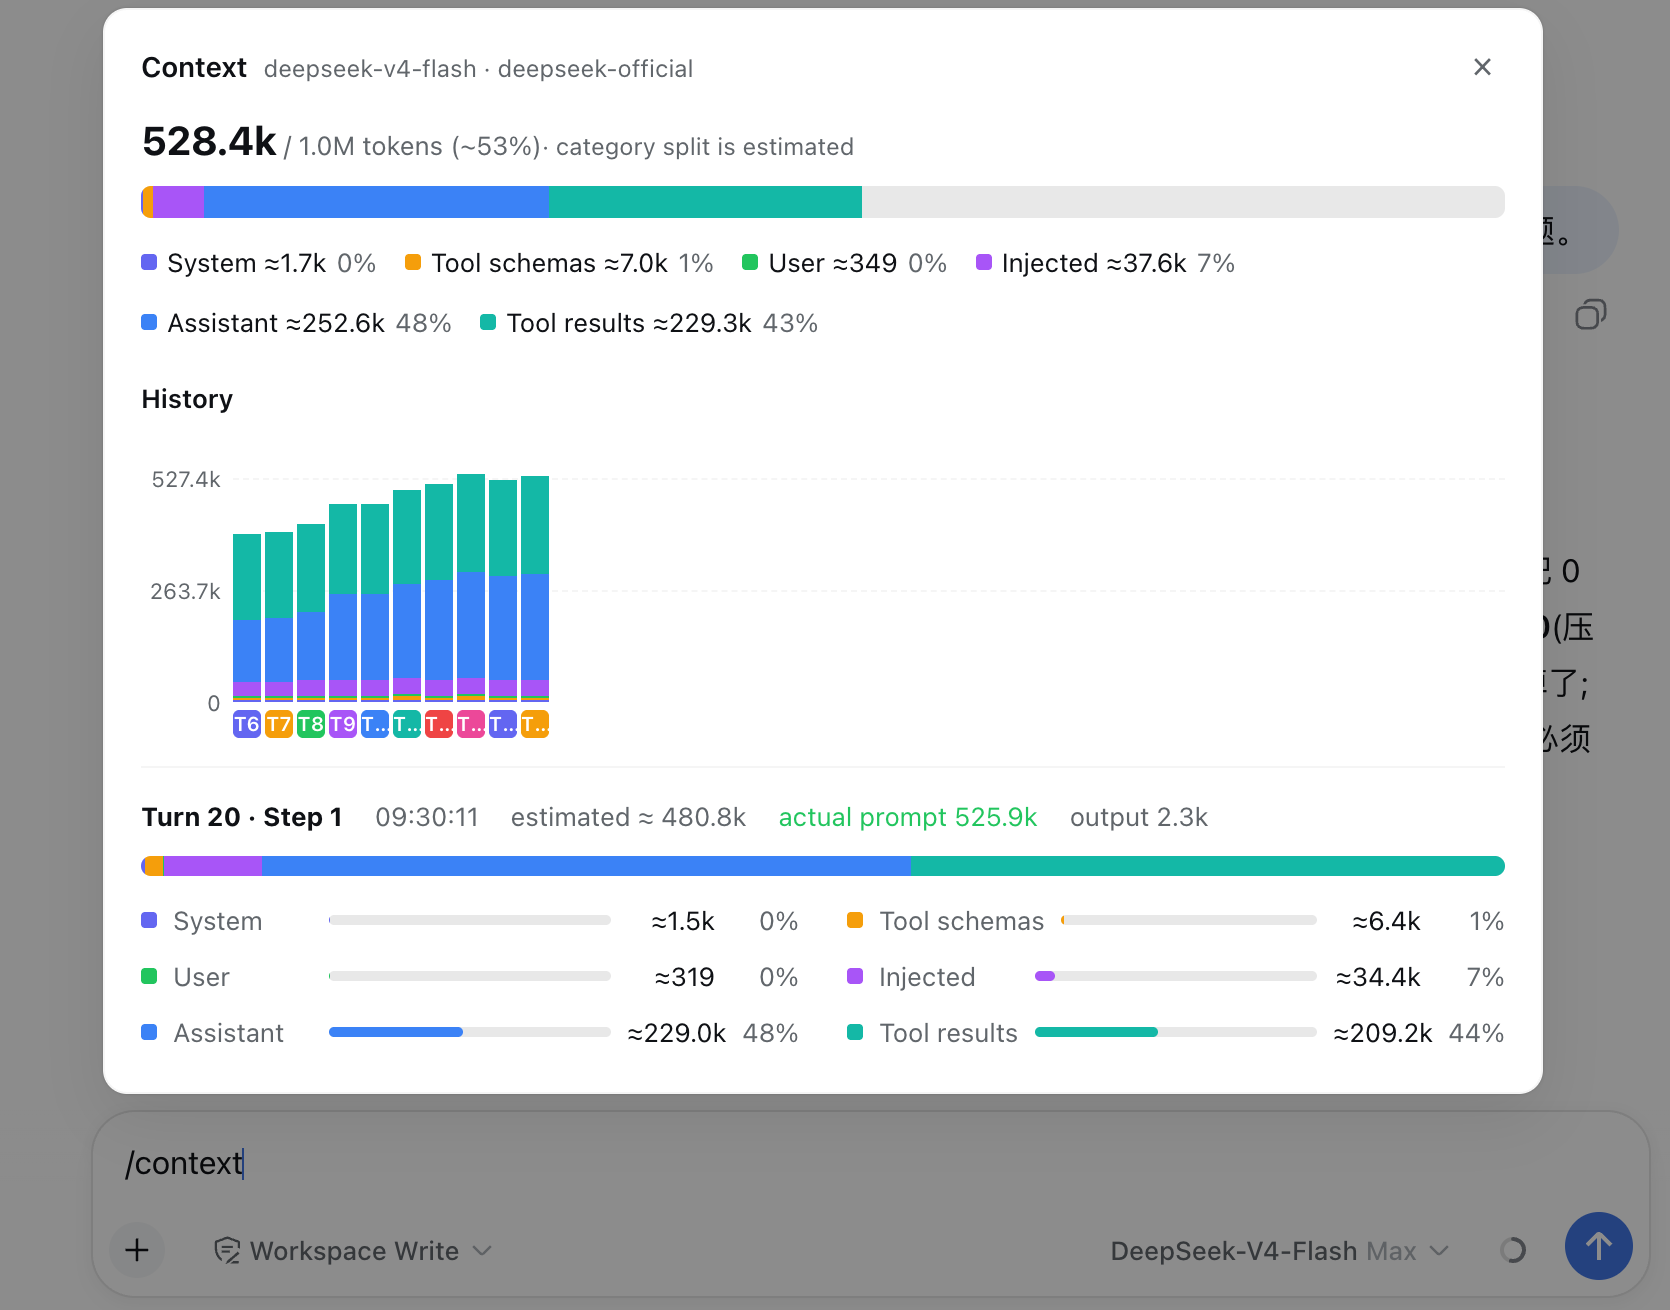
Type /context (or pick it from the / menu) and press Enter: a centered dialog shows the Current Composition card and the Context browser — the same composition bar, legend, and per-step browsing as the tab, so you can inspect what any request was assembled from without leaving the chat.
What you'll see
📊 Context stats — the session at a glance
Turns, steps, how many injections, compactions, and prunes have happened.
🧱 Current composition — what's in the window right now
A six-color stacked bar scaled against the model's full context window (the gray track is your remaining headroom): system prompt, tool schemas, your messages, injected context, assistant replies, and tool results — plus the top-5 most expensive tool schemas. When a conversation starts degrading, this is where you find out which part ate the budget.
📈 History — watch the window grow (and get compacted)
One stacked bar per model request, finer than per-message. Toggle between Turn and Step granularity, scroll sideways through the session, hover any bar for a quick tooltip, and click to pin the full breakdown — including provider-reported actual prompt/output tokens next to the estimate. Hovering a bar also drives the Context browser beside it — the browser previews that step's assembled context in real time as you scrub across the history. ✂ marks where compaction or pruning happened — watch the bars drop:
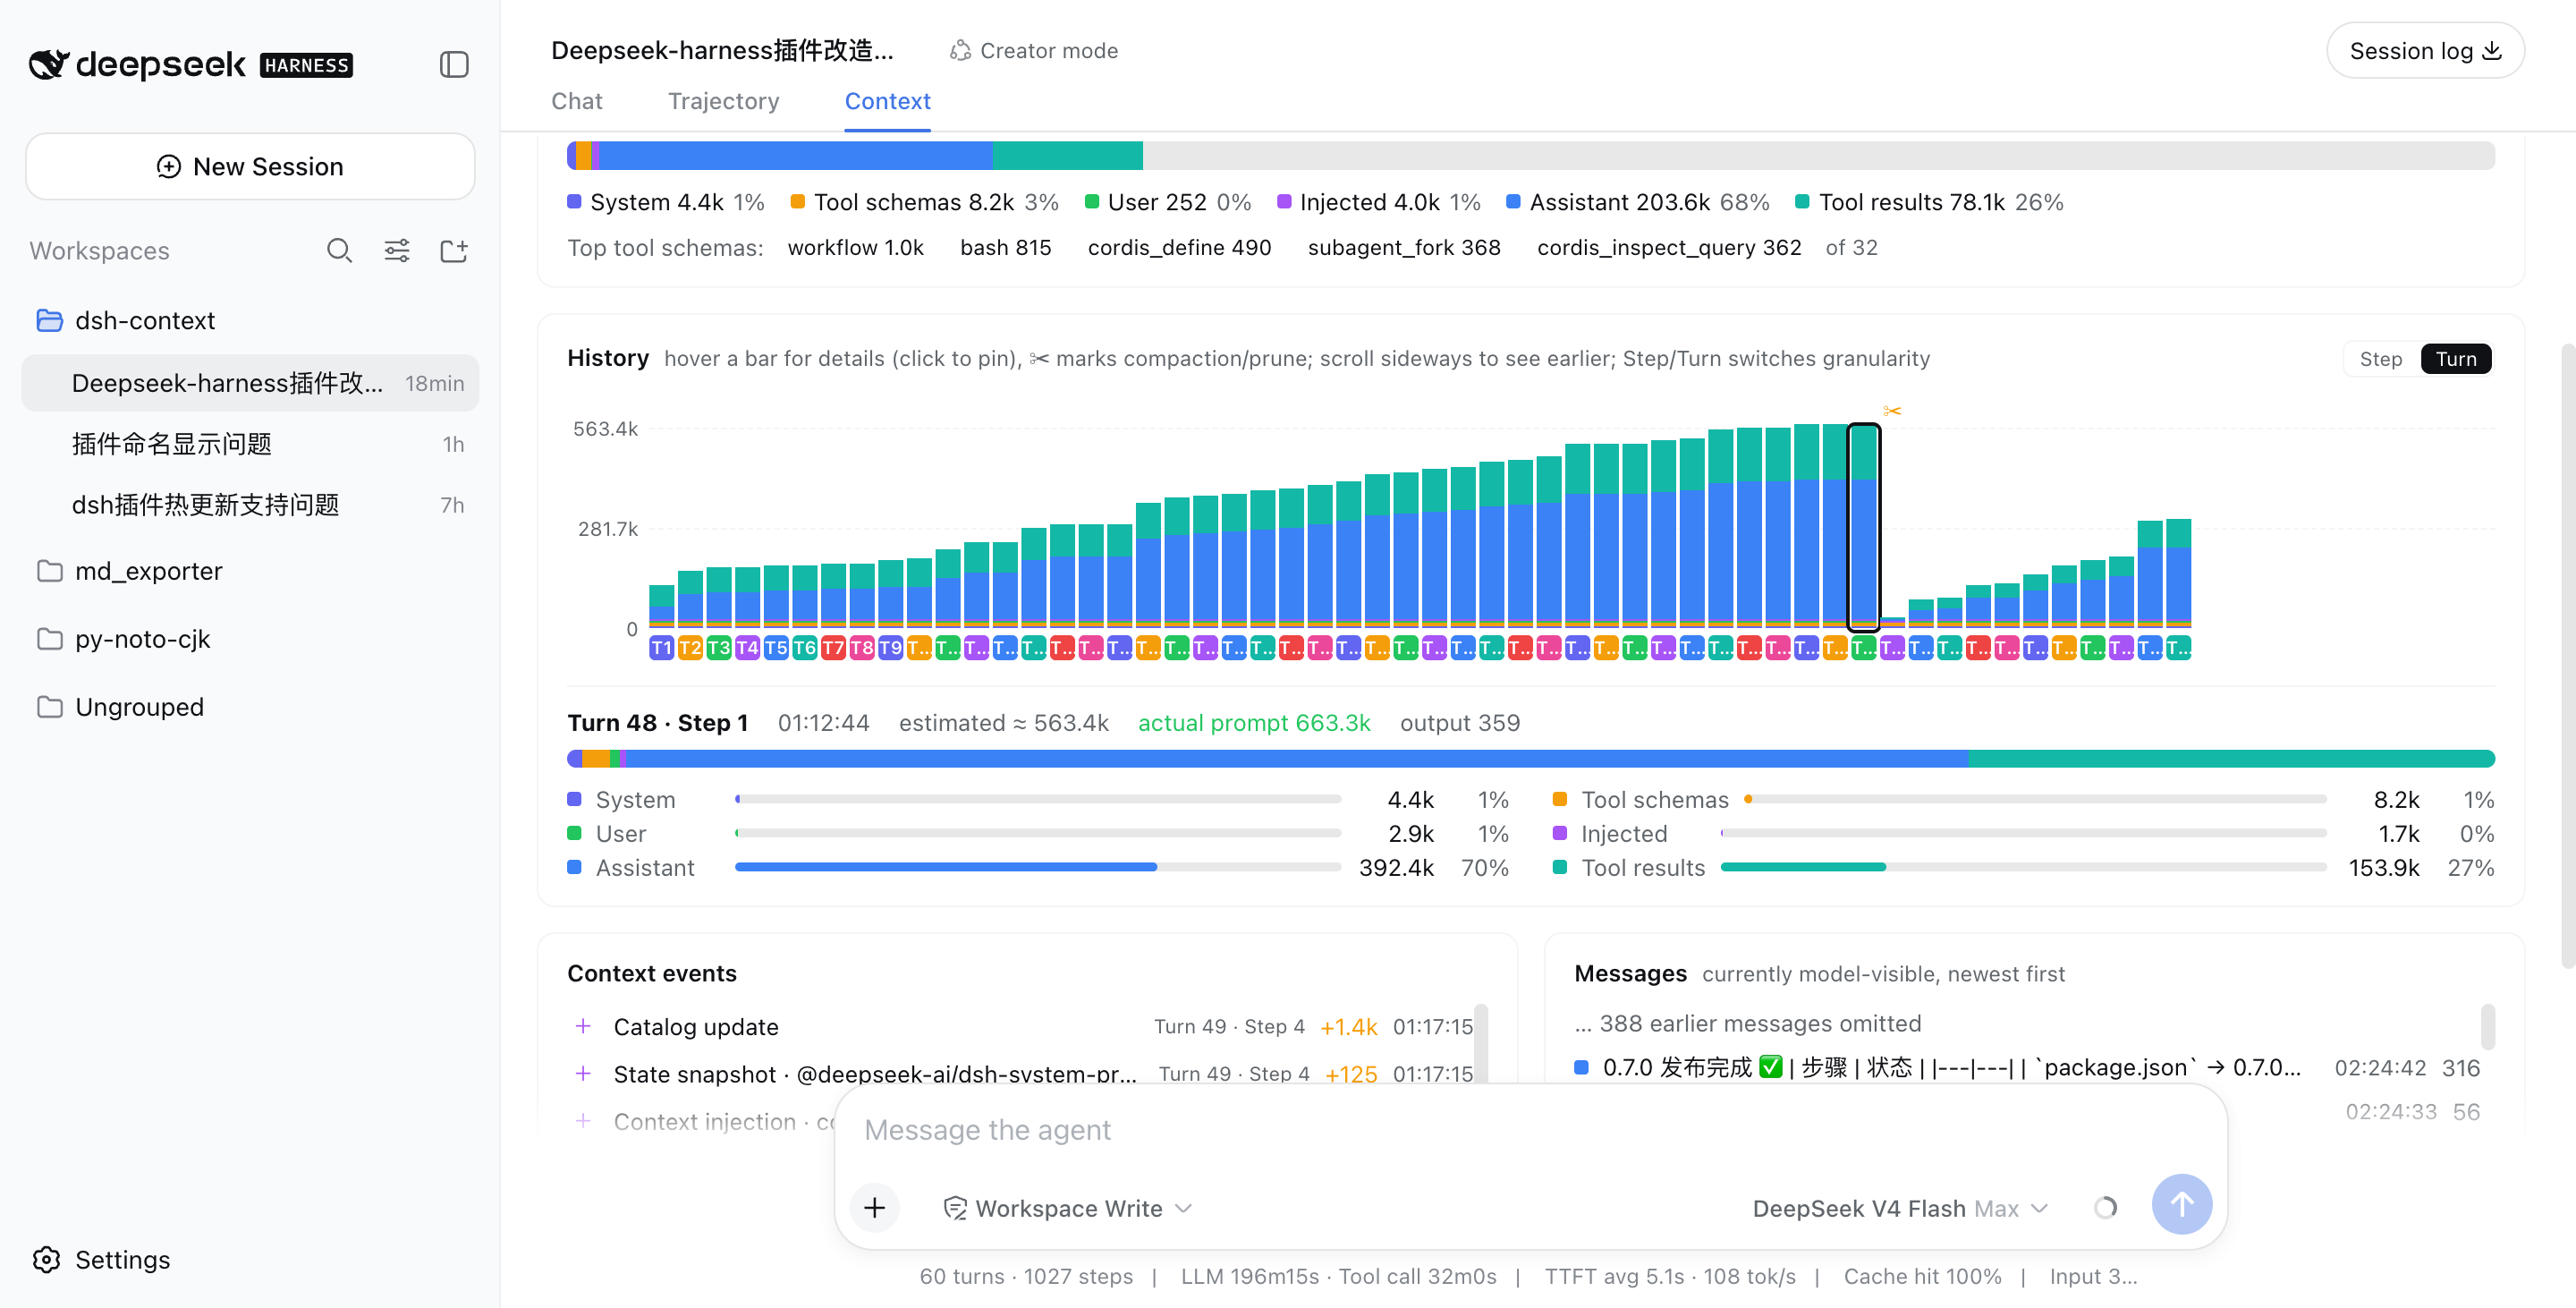
Above: a real session that grew to ~563k tokens across 48 turns, then compaction (✂) recycled −535.5k in one step, and the conversation continued from a fresh, small window.
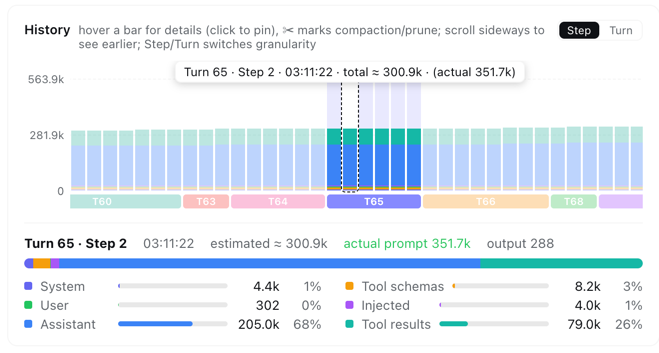
In Step granularity, hovering any bar shows that single step's context info instantly — its turn/step, timestamp, and estimated vs. provider-reported token counts:
⚡ Context events — when and why the window changed
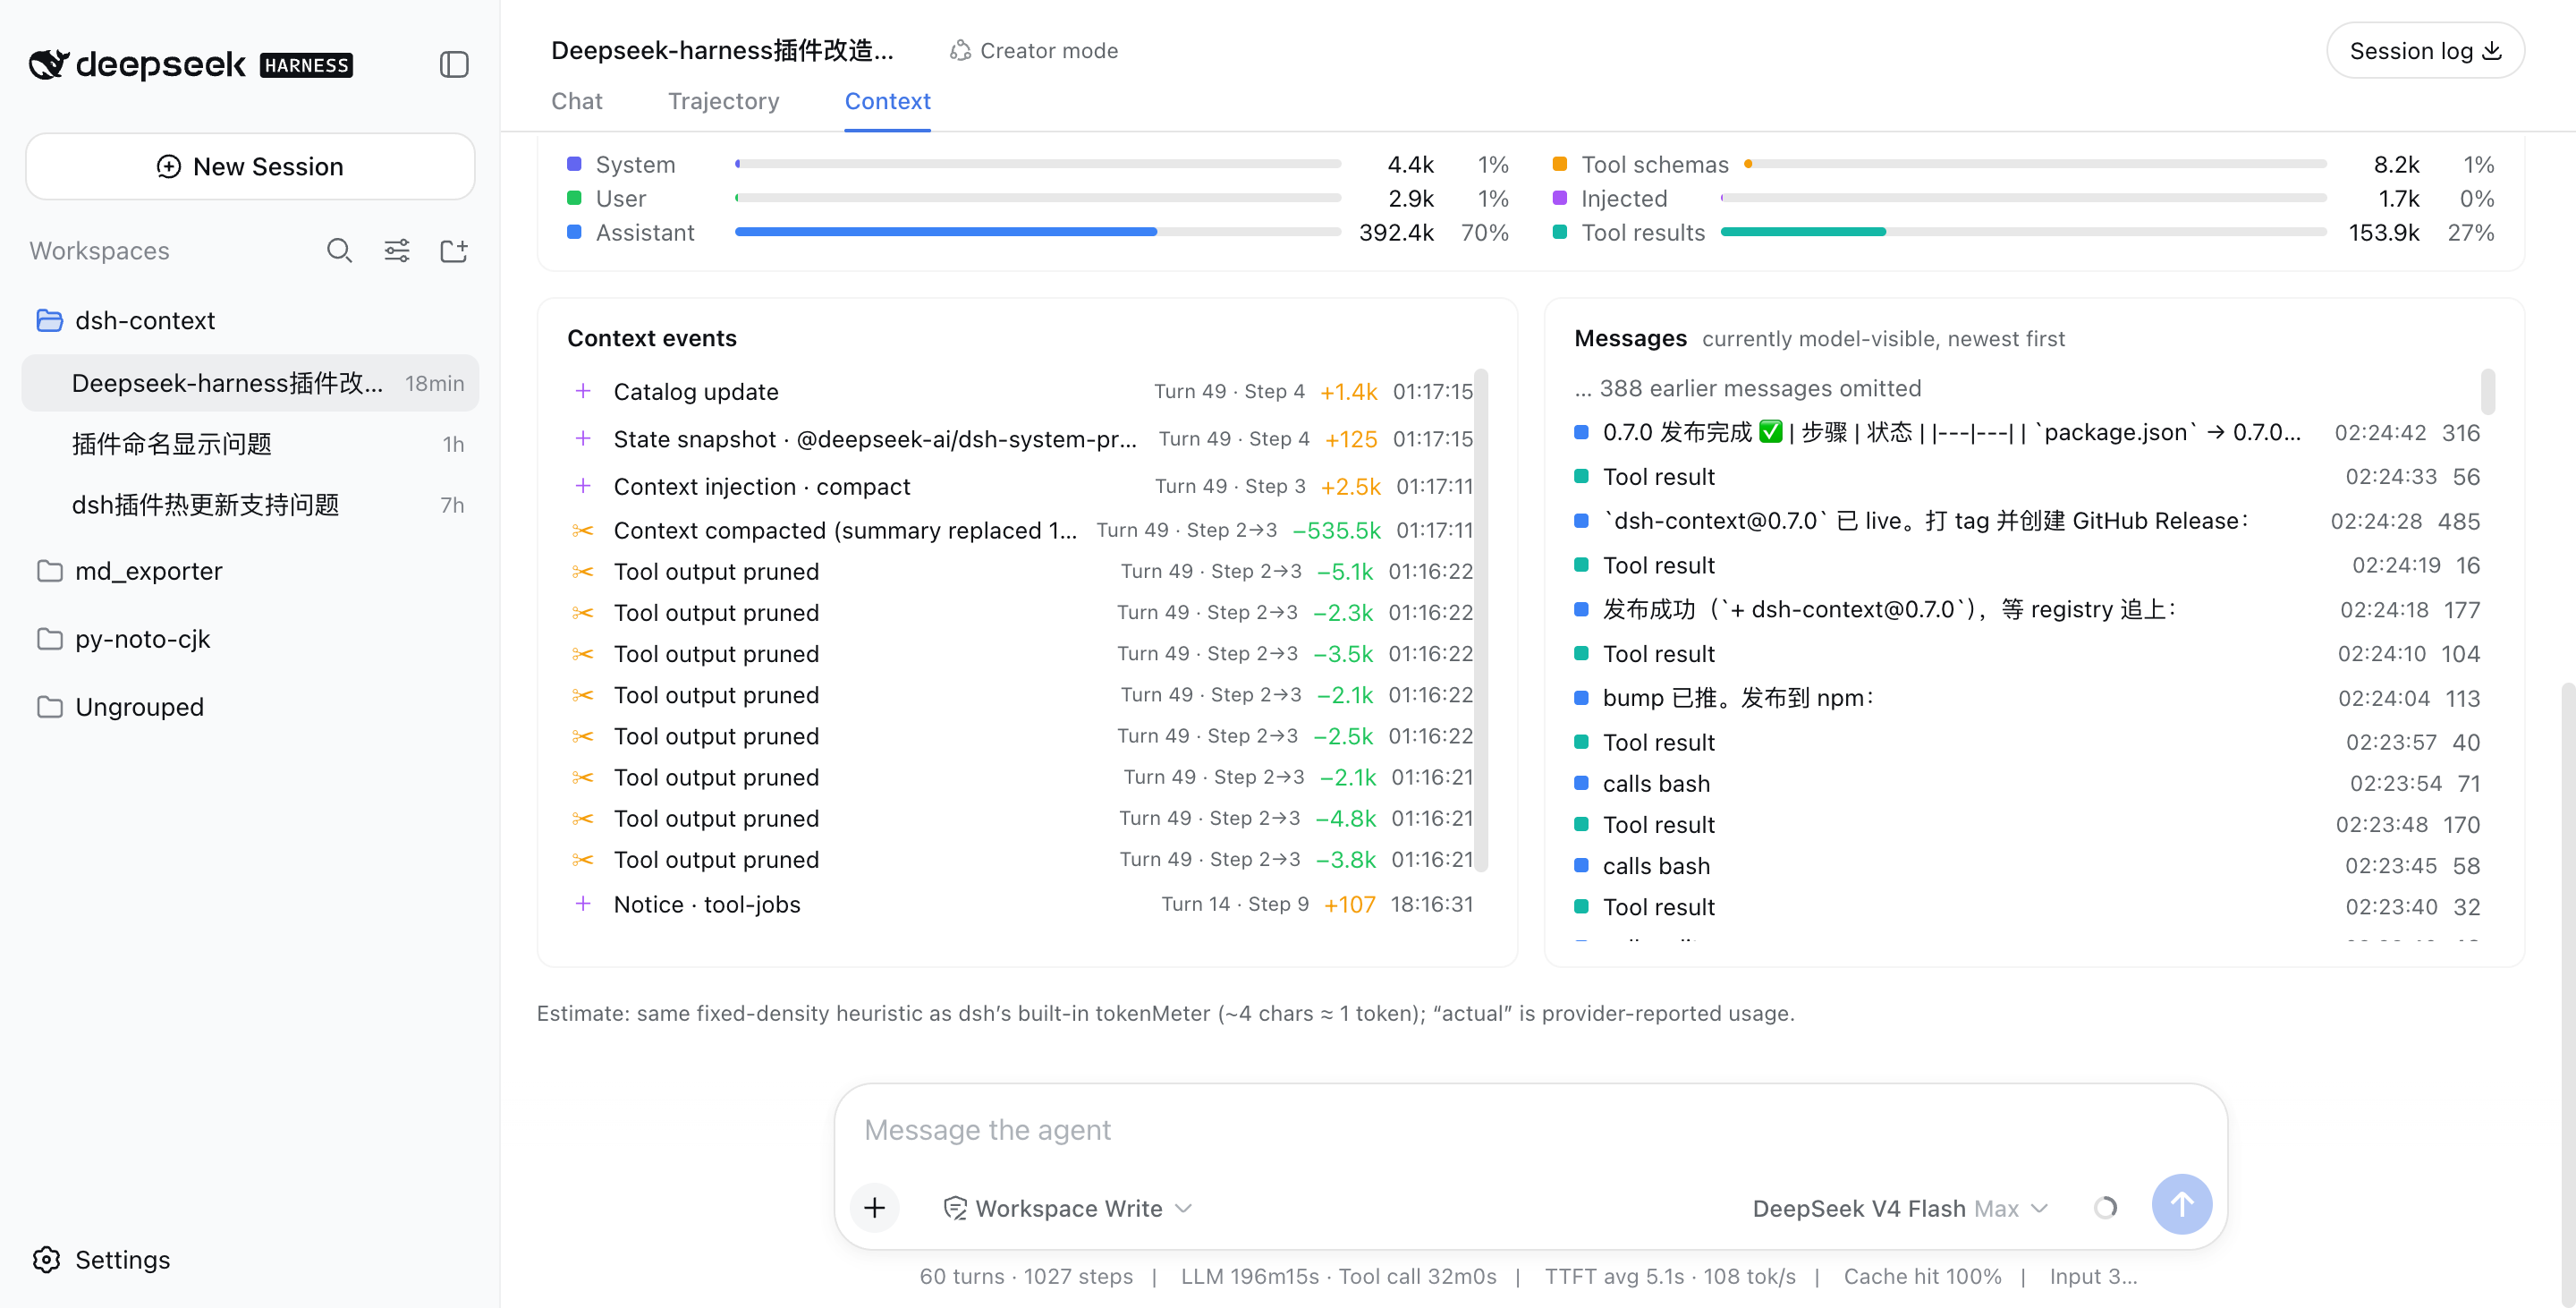
Every compaction, tool-output prune, skill or plugin context injection, and model switch — each with its token delta, turn/step attribution, and timestamp. Filter by category (Inject / Compact / Prune / Switch) to see exactly when each kind of event happened and its impact — e.g. when a skill was injected, when instructions were added, or how much a compaction reclaimed:
💬 Messages — the currently model-visible surface
The exact message list the model sees right now, newest first, with a per-message token cost.
🧭 Context browser — open the box of any request
Pick Live (next request) or any retained step from the picker, and browse what that request was actually assembled from:
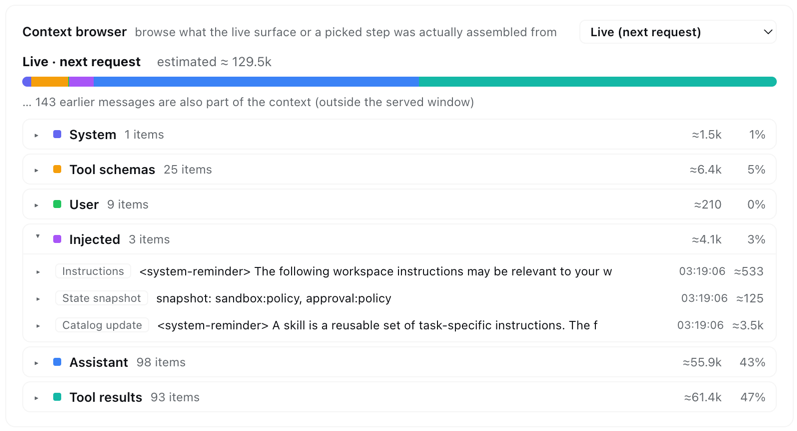
Six collapsible category sections (system prompt, tool schemas, user messages, injected context, assistant replies, tool results) expand into one row per element — each with its token price — and every element expands again into its actual content: the full system prompt, each tool's description and JSON schema, message text, reasoning, tool-call arguments, and tool outputs.
- Linked with the history chart — hover any bar in the History card and the browser previews that step instantly; leave the chart and it returns to your own pick. Keep a category open while scrubbing to compare one category across steps.
- Honest about coverage — steps before a compaction are reconstructed from the removed-message archive, and the card says so when a step's makeup is only approximate. Elements older than the loaded chat window page older history in automatically when you expand them, and live injections (AGENTS.md, session-start context, …) are always listed — never a token sum without its items.
Like it?
If dsh-context helped you understand what your agent is carrying around, a ⭐ on GitHub is much appreciated — and issues/PRs are welcome!
License
Read the usage guide →
Install steps, key points, FAQ and compatibility for this plugin — auto-derived from indexed fields.
Listing badge

[](https://deepseek-plugin.org/plugins/bowenliang123/dsh-context)Paste this markdown into your GitHub README to link back to this listing. The badge only states the listing — not a security endorsement.