Provides a colored usage dashboard for DSH Web: automatically records token usage per response, aggregates and displays 14-day trends, model distribution, and session rankings by session/day/model, with cost estimation based on DeepSeek pricing. Data is stored locally at ~/.dsh/usage.json.
ⓘ This plugin is a sub-package of the CAPTAIN1275/dsh-ui-web monorepo — stars and activity count the whole repository.

- Language
- TypeScript
- License
- Apache-2.0
- Branch
- main
Install
$ dsh plugin --profile web add @captain1275/dsh-usage-dashboardRun the command above in your terminal to install this plugin via the dsh CLI. You can switch Profile in the top-right corner. New to dsh? Read the beginner tutorial
Install via your agent
Install the DeepSeek Harness plugin CAPTAIN1275/dsh-ui-web/packages/dsh-usage-dashboard for me: review the repository at https://github.com/CAPTAIN1275/dsh-ui-web first, then run the install command and verify the plugin loads successfully.
Paste this instruction to the DSH Web GUI assistant — it will install and verify for you.
One-Line Description
Provides a colorful usage dashboard for DSH Web that automatically records token usage for each model response and persists it to ~/.dsh/usage.json. Displays 14-day trend bar charts, model distribution ring charts, and top 20 session rankings, with cost estimation based on DeepSeek's official pricing.
Core Capabilities
- Automatic Token Usage Collection: Attaches an invisible recording seat to the conversation footer that monitors token usage projected in real-time streaming. After 2 seconds of silence, the cumulative session snapshot is reported to the host (historical data before refresh is not counted as new)
- Colorful Statistics Dashboard: Click the sidebar entry to pop up a full-screen overlay, rendering four gradient cards (cumulative tokens / call count / cache hits / estimated cost) with three dimensions: 14-day trends, model distribution, and session rankings
- Cost Estimation: Matches model names against DeepSeek's public pricing tiers (v4-flash, v4-pro, reasoner, legacy). Cache hits separately use cache tier unit pricing to avoid double billing
- Session Snapshot Replacement Semantics: The host only keeps the latest snapshot for the same session. Multiple reports are accumulated as "increments" to day/model/total buckets. Refresh and session switching won't result in duplicate entries
- LAN QR Code Entry: The "View on Phone" button in sidebar calls the host interface to enumerate local IPv4 addresses, prioritizes 192.168 / 10 / 172.x, and renders a QR code with a copyable link combined with the current port
- Check for Updates Entry: Reuses the same glass-style popup, calls host
/api/web-ui/versionto display current and latest version numbers - Settings Panel Info Card: A pure description card (no config fields) in the Web UI plugin group's settings page that explains the dashboard's record location and data landing point
Technical Implementation
- Language: TypeScript (peer dependency React 18.2,
dsh.client.platform="web") - Key Dependencies:
@deepseek-ai/dsh-host-webserver(route host),@deepseek-ai/dsh-token-meter(token usage projection types),@deepseek-ai/dsh-client-connection(pull session model),qrcode-generator(QR code for phone view) - Architecture Pattern: Cordis bidirectional plugin. The Host half injects prefix routes
/api/usage/{record,lan,summary}intowebServerand writes aggregated data back to~/.dsh/usage.json; the Client half attaches an invisible recording seat in theconversation.composer.dockslot, uses DOM injection to insert three buttons into the sidebar, and mounts a description card in theweb-ui.plugin.itemslot - Entry Files: Host side
src/index.ts(exportsname/USAGE_API_PREFIX/applyand aggregation pure functions), client sidesrc/client/index.ts; cost tiers are centralized insrc/cost.ts, UI rendering is centralized insrc/client/DashboardPanel.tsxandsrc/client/UsageEntry.tsx
Use Cases
When you want to know "how many tokens I used in the past two weeks, which models cost the most, and which sessions ran the most," this plugin presents all data in visualization charts with local archiving and no server upload. Suitable for heavy users sensitive to call costs, developers needing reconciliation within teams, and ops/PMs doing long-term review of model rate/call distribution.
Prerequisites & Compatibility
| Dependency | Min Version | Description |
|---|---|---|
| DSH Web | 0.1.0-rc.6 | peerDependencies pinned to ^0.1.0-rc.6 (includes @deepseek-ai/dsh-client-connection, @deepseek-ai/dsh-host-webserver), cordis patch ui-usage-dashboard needs to be resolved by host |
| React | 18.2.0 | Client cards, dashboard overlay, and sidebar DOM injection all depend on React 18 |
| Platform | Cross-platform (macOS / Windows / Linux) | Runtime is OS-agnostic; dashboard only renders on Web host, persistence file goes to host-side ~/.dsh directory |
| Native Modules | None | All logic in TypeScript / React, QR code uses pure browser qrcode-generator, no node-gyp dependencies |
| Node | Not declared | No engines field in package, but runtime needs Node built-in node:fs, node:os, node:http modules |
Installation
dsh plugin --profile web add github:CAPTAIN1275/dsh-ui-web/packages/dsh-usage-dashboard
After installation, restart dsh web for the host routes /api/usage/{record,lan,summary} to be registered. The sidebar will automatically have three additional buttons: "Usage / View on Phone / Check Updates" (same source DOM injection mode as the task dashboard, self-heals during React re-renders).
Optional: Change the persistence directory via DSH_HOME environment variable (e.g., export DSH_HOME=/path/to/dir), data will go to $DSH_HOME/usage.json instead of default ~/.dsh/usage.json.
Configuration
This plugin requires no additional configuration. All three behavior parameters are hardcoded in the source code:
| Behavior | Value | Source |
|---|---|---|
| Recording silence threshold (per response end detection) | 2 seconds | src/client/UsageRecorder.tsx:36 (SETTLE_MS = 2000) |
| Model polling interval (fetch current session model name) | 5 seconds | src/client/index.ts:95 (window.setInterval(..., 5000)) |
| Dashboard review days | 14 days | src/index.ts:304 (recentDays(store, 14)) |
The card mounted under the "Web UI Plugins" group in settings is a pure description card, exposing no toggles or input fields.
FAQ
Q: Do I need to restart DSH Web after installation?
A: Yes. The host half registers routes through ctx.inject(['webServer']); the host process won't invoke apply without restart. Browser hard refresh only remounts the recording seat and sidebar DOM, it cannot bring /api/usage/* routes online.
Q: Where is data stored? How to clear it?
A: Defaults to ~/.dsh/usage.json. Can change directory via DSH_HOME environment variable (process.env.DSH_HOME ?? join(homedir(), '.dsh'), src/index.ts:86). Deleting that file completely clears history; the plugin won't automatically migrate or back up. Next restart will start accumulating from an empty file.
Q: What unit price is used for cost estimation? Is it accurate?
A: Matches model names against DeepSeek's official public tiers: flash → v4-flash, reasoner / r1 → reasoning tier, pro / v4-pro → v4-pro, deepseek → legacy tier, others fall back to generic tier (src/cost.ts:39-46). This is an estimation for dashboard display, not a billing reference; cache hits separately use cache tier unit pricing, input tokens don't include cache portion, won't be calculated with cache tier separately.
Q: Will billing double-count tokens from a single session?
A: No. The client uses session cumulative snapshot replacement semantics: the recording component's first mount only records baseline without reporting (src/client/UsageRecorder.tsx:106-110), subsequent reports only happen after token usage "actually increases" and 2 seconds of silence (flush function). The host only keeps the latest snapshot for the same session, writes increment to day/model/total buckets using "new value minus old value"; when projection resets to zero (e.g., refreshing session), it uses Math.max(0, ...) to clamp and prevent decrement (src/index.ts:148-151).
Q: What time zone does "Today" in the dashboard correspond to?
A: Local time zone. dayKey uses Date.getFullYear/getMonth/getDate to construct YYYY-MM-DD (src/index.ts:90-95), so new day's bar chart appears only after local midnight. Server time zone and browser time zone don't affect aggregation.
Q: Anything to do after uninstall?
A: Just uninstall the plugin and restart dsh web. The host-side dispose will unregister /api/usage/* routes, the client-side mountUsageEntry returned disposer will remove the three sidebar buttons and stop MutationObserver. The historical JSON file won't be automatically deleted, staying in place for review or manual backup.
Q: How does the sidebar's "View on Phone" work?
A: Clicking it calls /api/usage/lan to have the host enumerate all non-internal IPv4 addresses on the machine, prioritizes them in four tiers: "192.168 → 10. → 172.16-31 → others" (src/index.ts:274-287), and renders a QR code with a copyable link combined with the browser's current port for easy scanning on phone under the same Wi-Fi. Requires browser to allow navigator.clipboard.writeText for copying (silently fails in insecure contexts).
Q: Supports TUI, desktop, or mobile?
A: Not currently supported. The client half's UI is entirely based on DSH Web's sidebar shell and composer dock slots; TUI, desktop, and mobile have no equivalent mounting positions. The host-side /api/usage/* routes also have no UI rendering in non-Web forms, but the host-side persistence logic itself is platform-agnostic and still writes to ~/.dsh/usage.json.
Difficulty Level
Beginner — One-line install command, restart DSH Web to see effect, all behavior parameters are hardcoded and require no adjustment. Only need to touch environment variables when wanting to change persistence directory or reconcile unit prices.
Known Issues & Limitations
- Zero-config but non-adjustable: Recording silence threshold, model polling interval, and dashboard review days are all hardcoded (2s / 5s / 14 days), no settings provided; must modify source code and rebuild to adjust
- Single-step recording: The recording component only watches the current session's
tokenUsageprojection cumulative, won't distinguish multiple round-trips within the same session; multiple concurrent sessions are independent and don't interfere, but after switching models in the same session, old model's usage stays under old model name - Session title backfill: The recording component only writes
currentTitleas session title into snapshot on first increase (src/client/UsageRecorder.tsx:118-124). If the session is renamed on client, the next response will refresh the title on dashboard - Estimated unit price lag: The cost tier table is hardcoded in source code from August 2026 (
src/cost.ts:18-27). After DeepSeek adjusts prices,cost.tsneeds modification and rebuild; the dashboard won't automatically fetch the latest official prices - QR code copy permission: The "Copy Address" button for View on Phone uses
navigator.clipboard.writeText, browsers may silently fail under non-https / non-localhost, but the QR code and address text remain visible - Model name "unknown": If the
modelfield is missing when reported by host-side/api/usage/record, it's normalized to stringunknownand bucketed underbyModel.unknown(src/index.ts:244), won't cause entire record to be discarded

基于 zhu1090093659/dsh-web-ui(Apache-2.0)开发的 DeepSeek Harness(DSH)Web UI 插件套件。全套 22 个包已发布到 npm(
@captain1275/*)。
DSH Web UI 全家桶为 DeepSeek Harness 的 Web 界面提供一系列插件与皮肤:极光毛玻璃皮肤、任务看板、 SSH 运维、右侧文件/变更面板、Git 图谱、移动端远程控制、DeepSeek 娘看板娘(养成系)、实时令牌统计, 以及皮肤中心。所有插件既可独立安装,也可通过聚合包一次装齐。
极光 Aurora 皮肤效果(沉浸光感 / 深色 / 浅色)
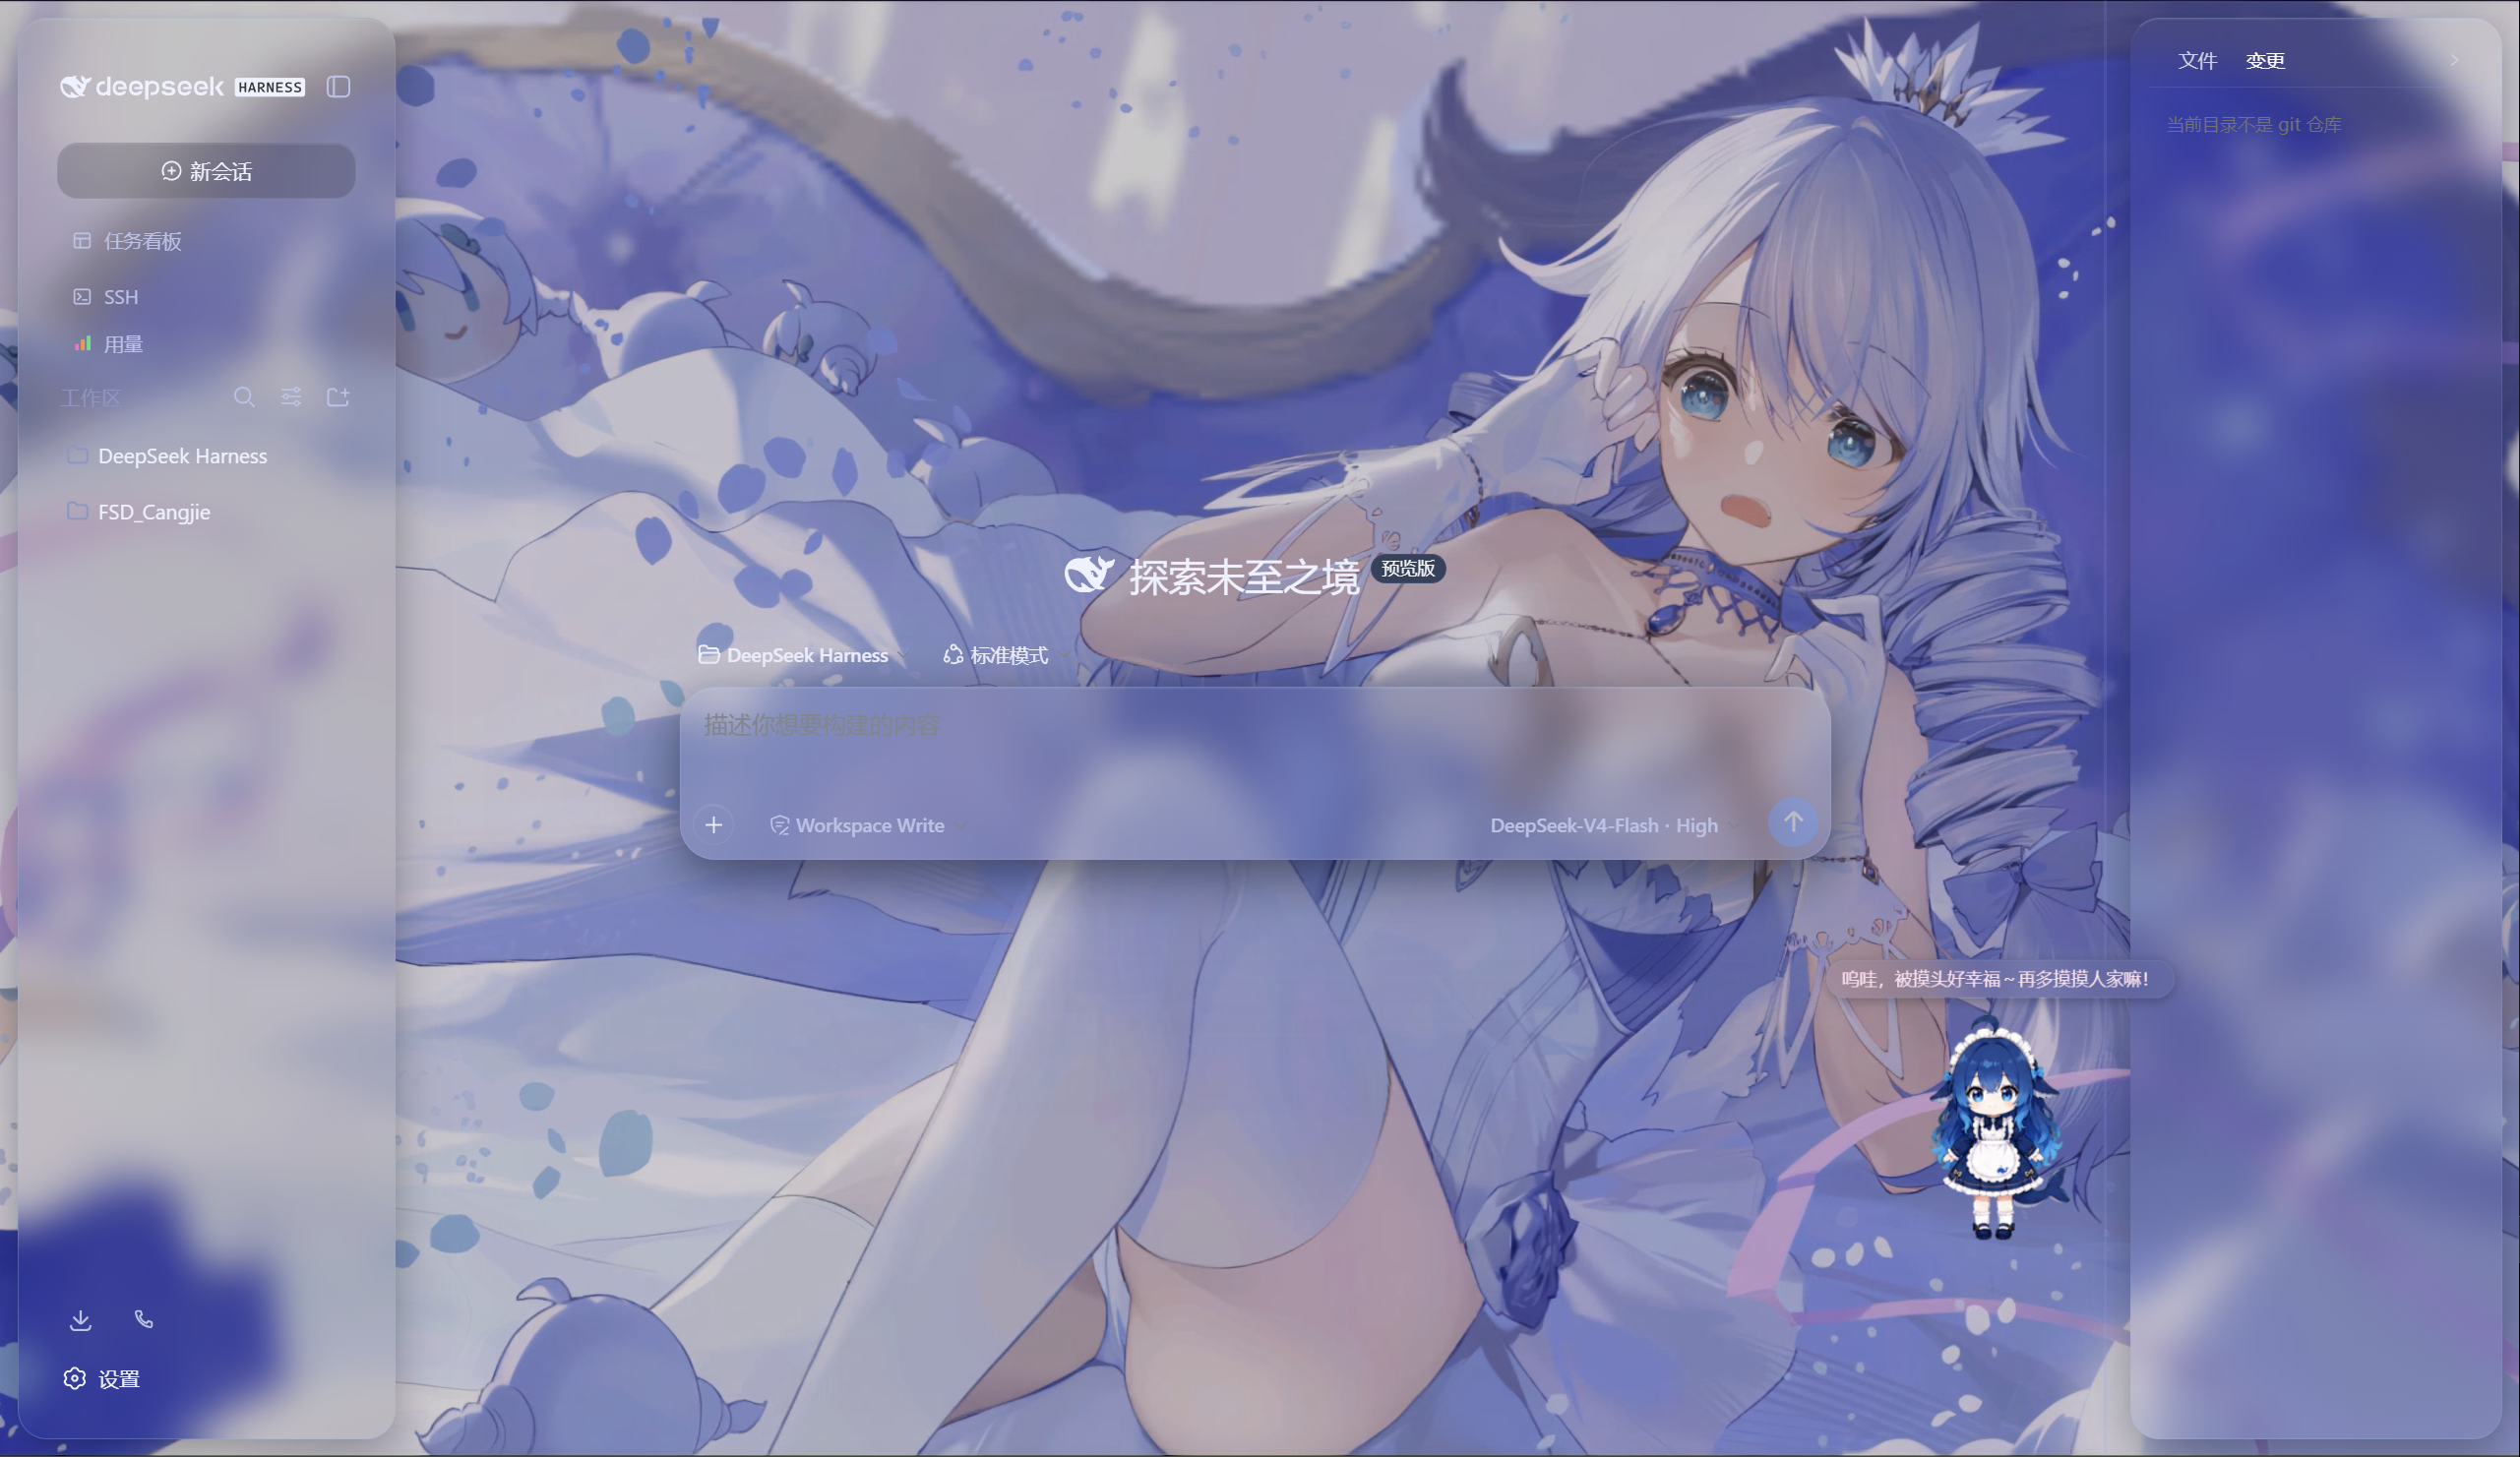
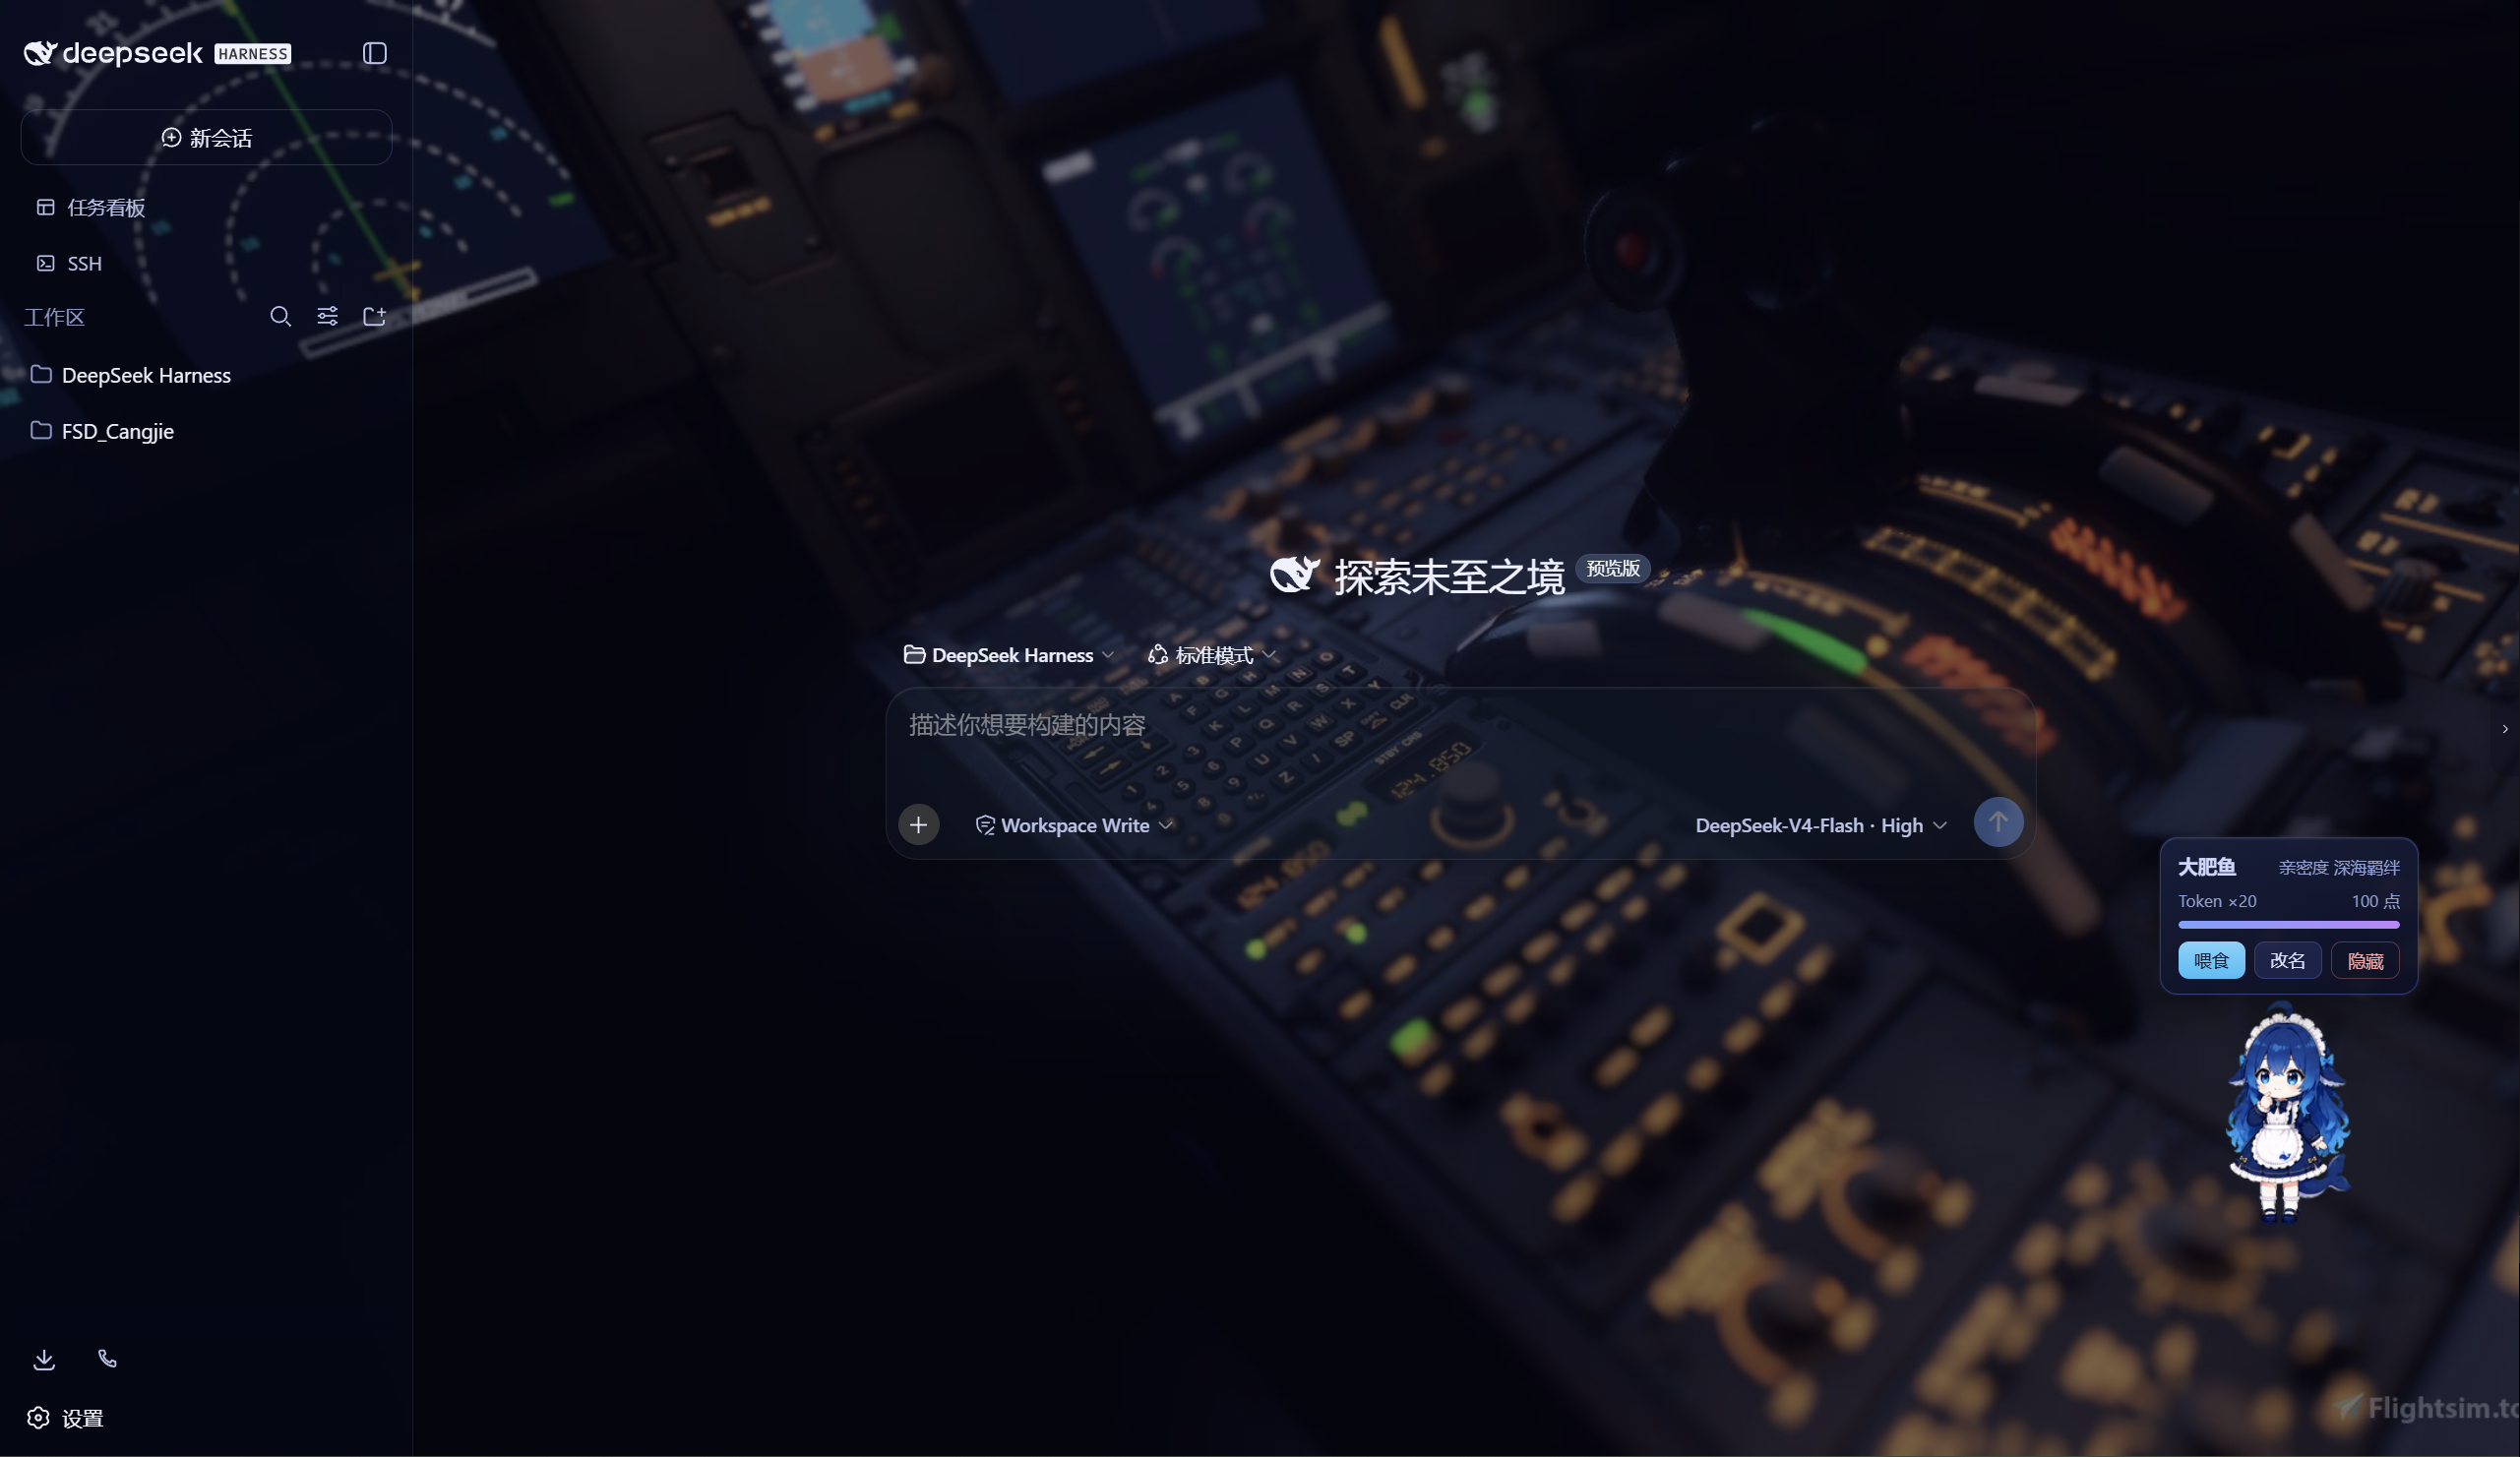
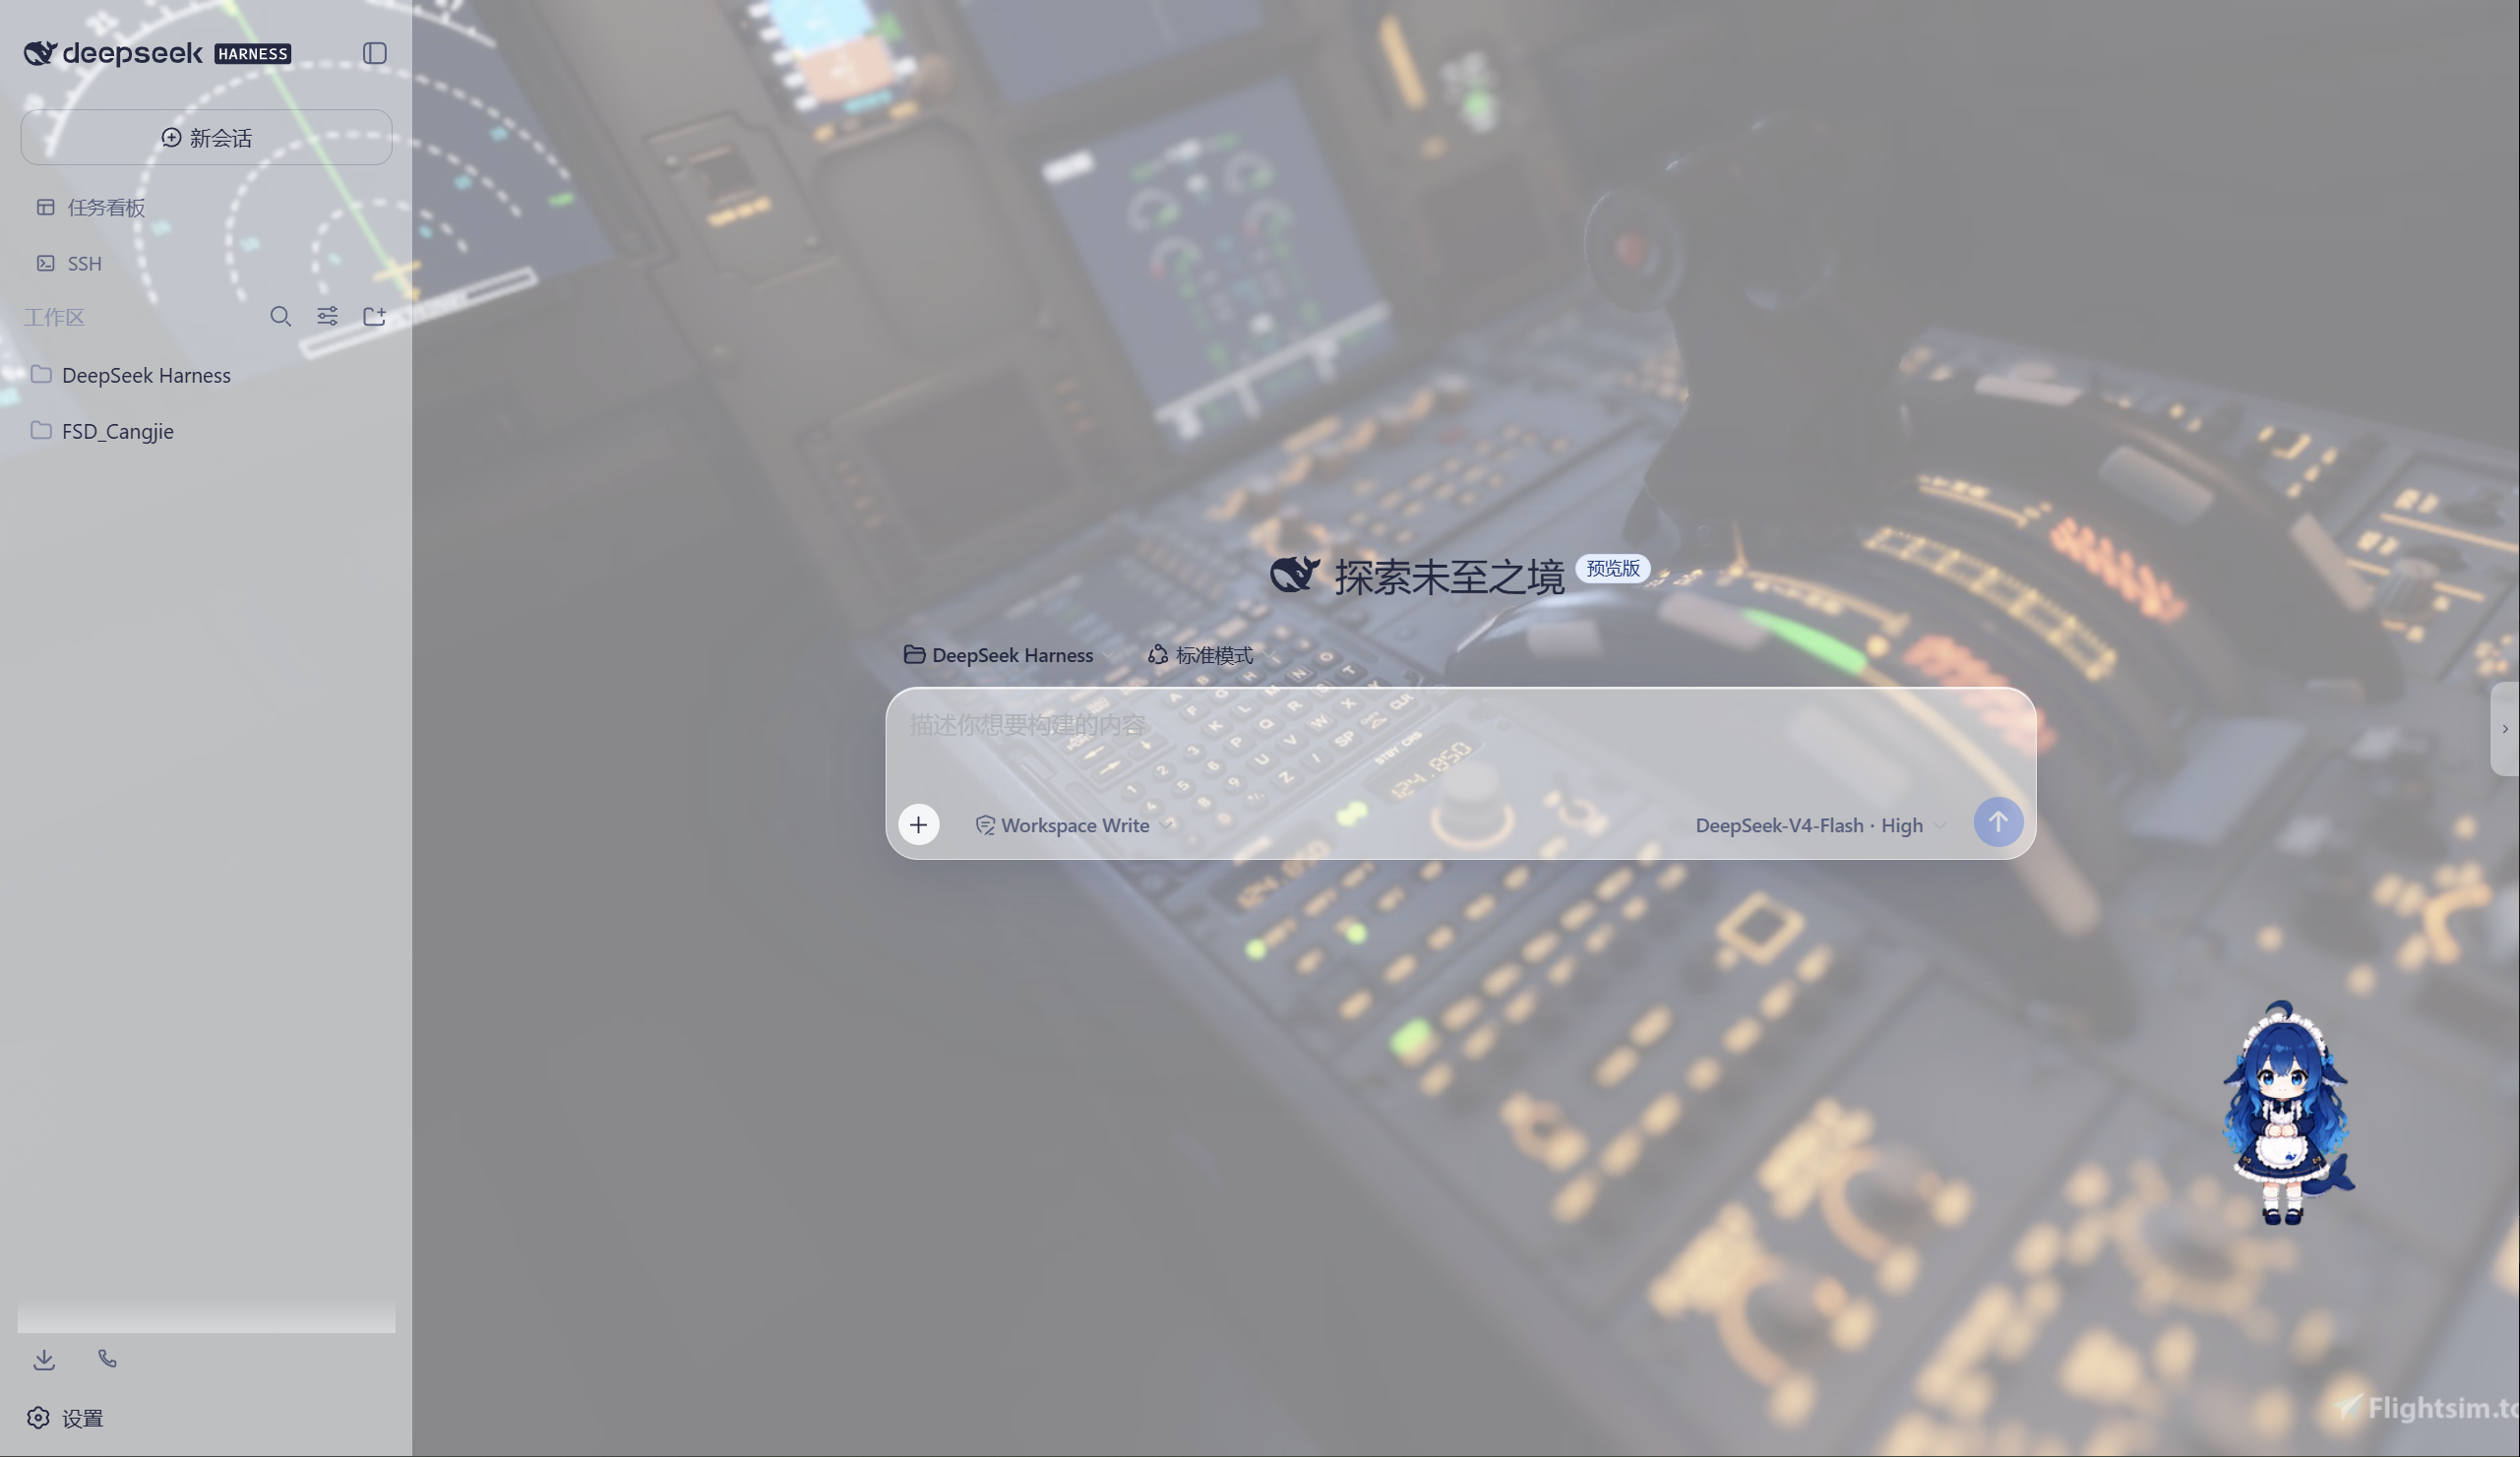
特性
极光(Aurora)皮肤(支持动态背景)
- 毛玻璃输入框:高斯模糊(backdrop-filter 30px)+ 半透明玻璃底 + 细边框 + 内高光
- 自定义背景:URL / 本地图片 / 动图(GIF/WebP)/ 视频(mp4/webm) / 透明度 / 模糊调节,
深浅两套极光渐变;视频背景支持静音开关、本地文件持久化(存
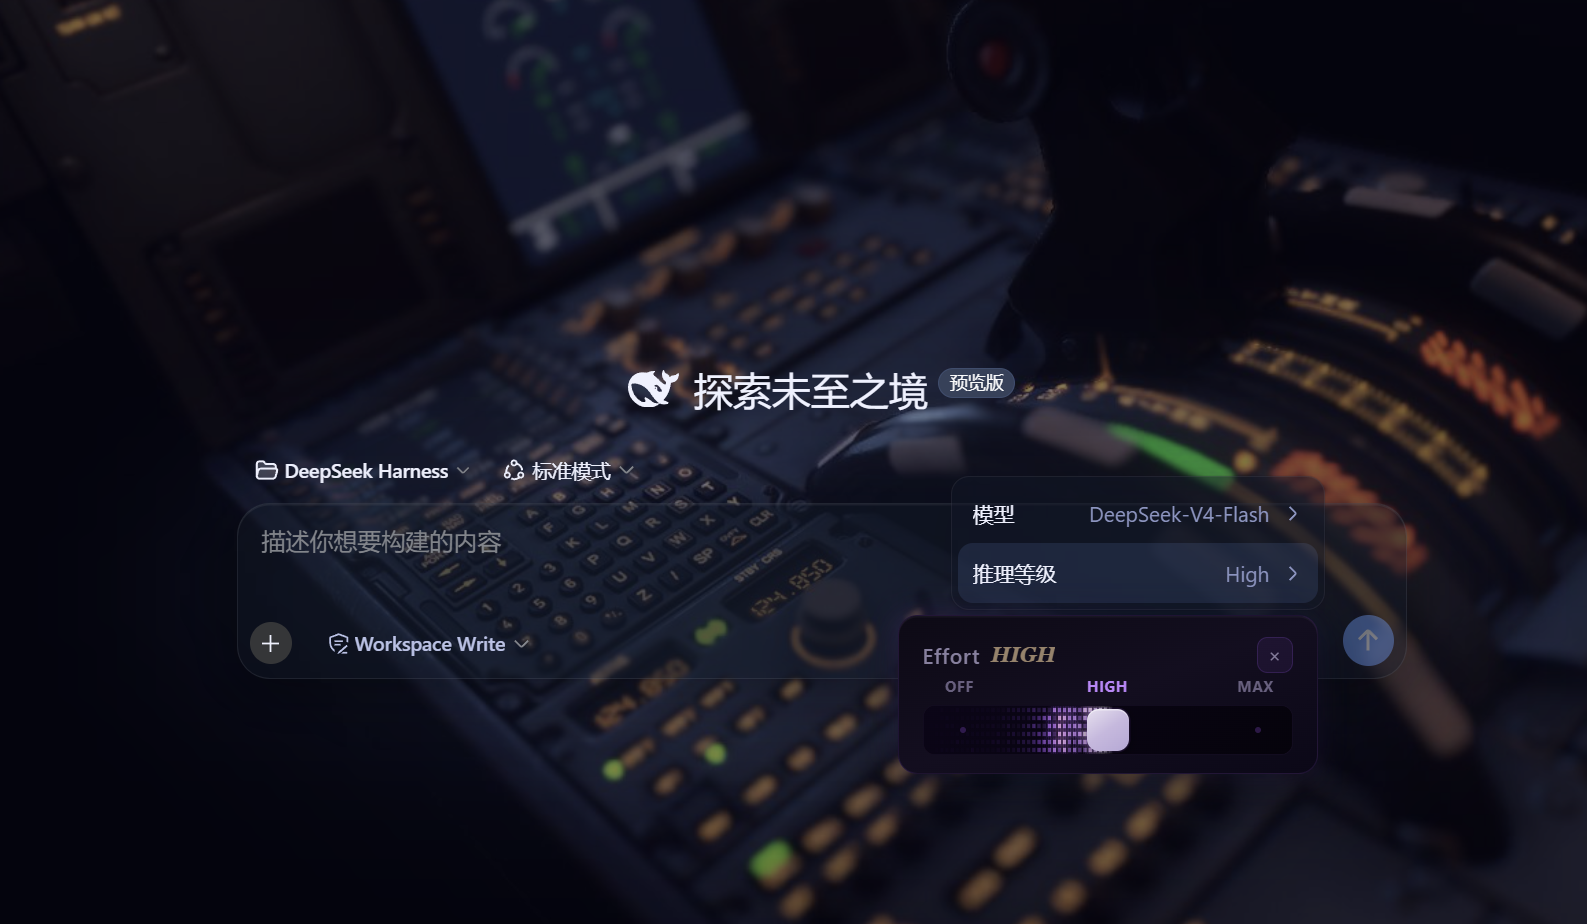
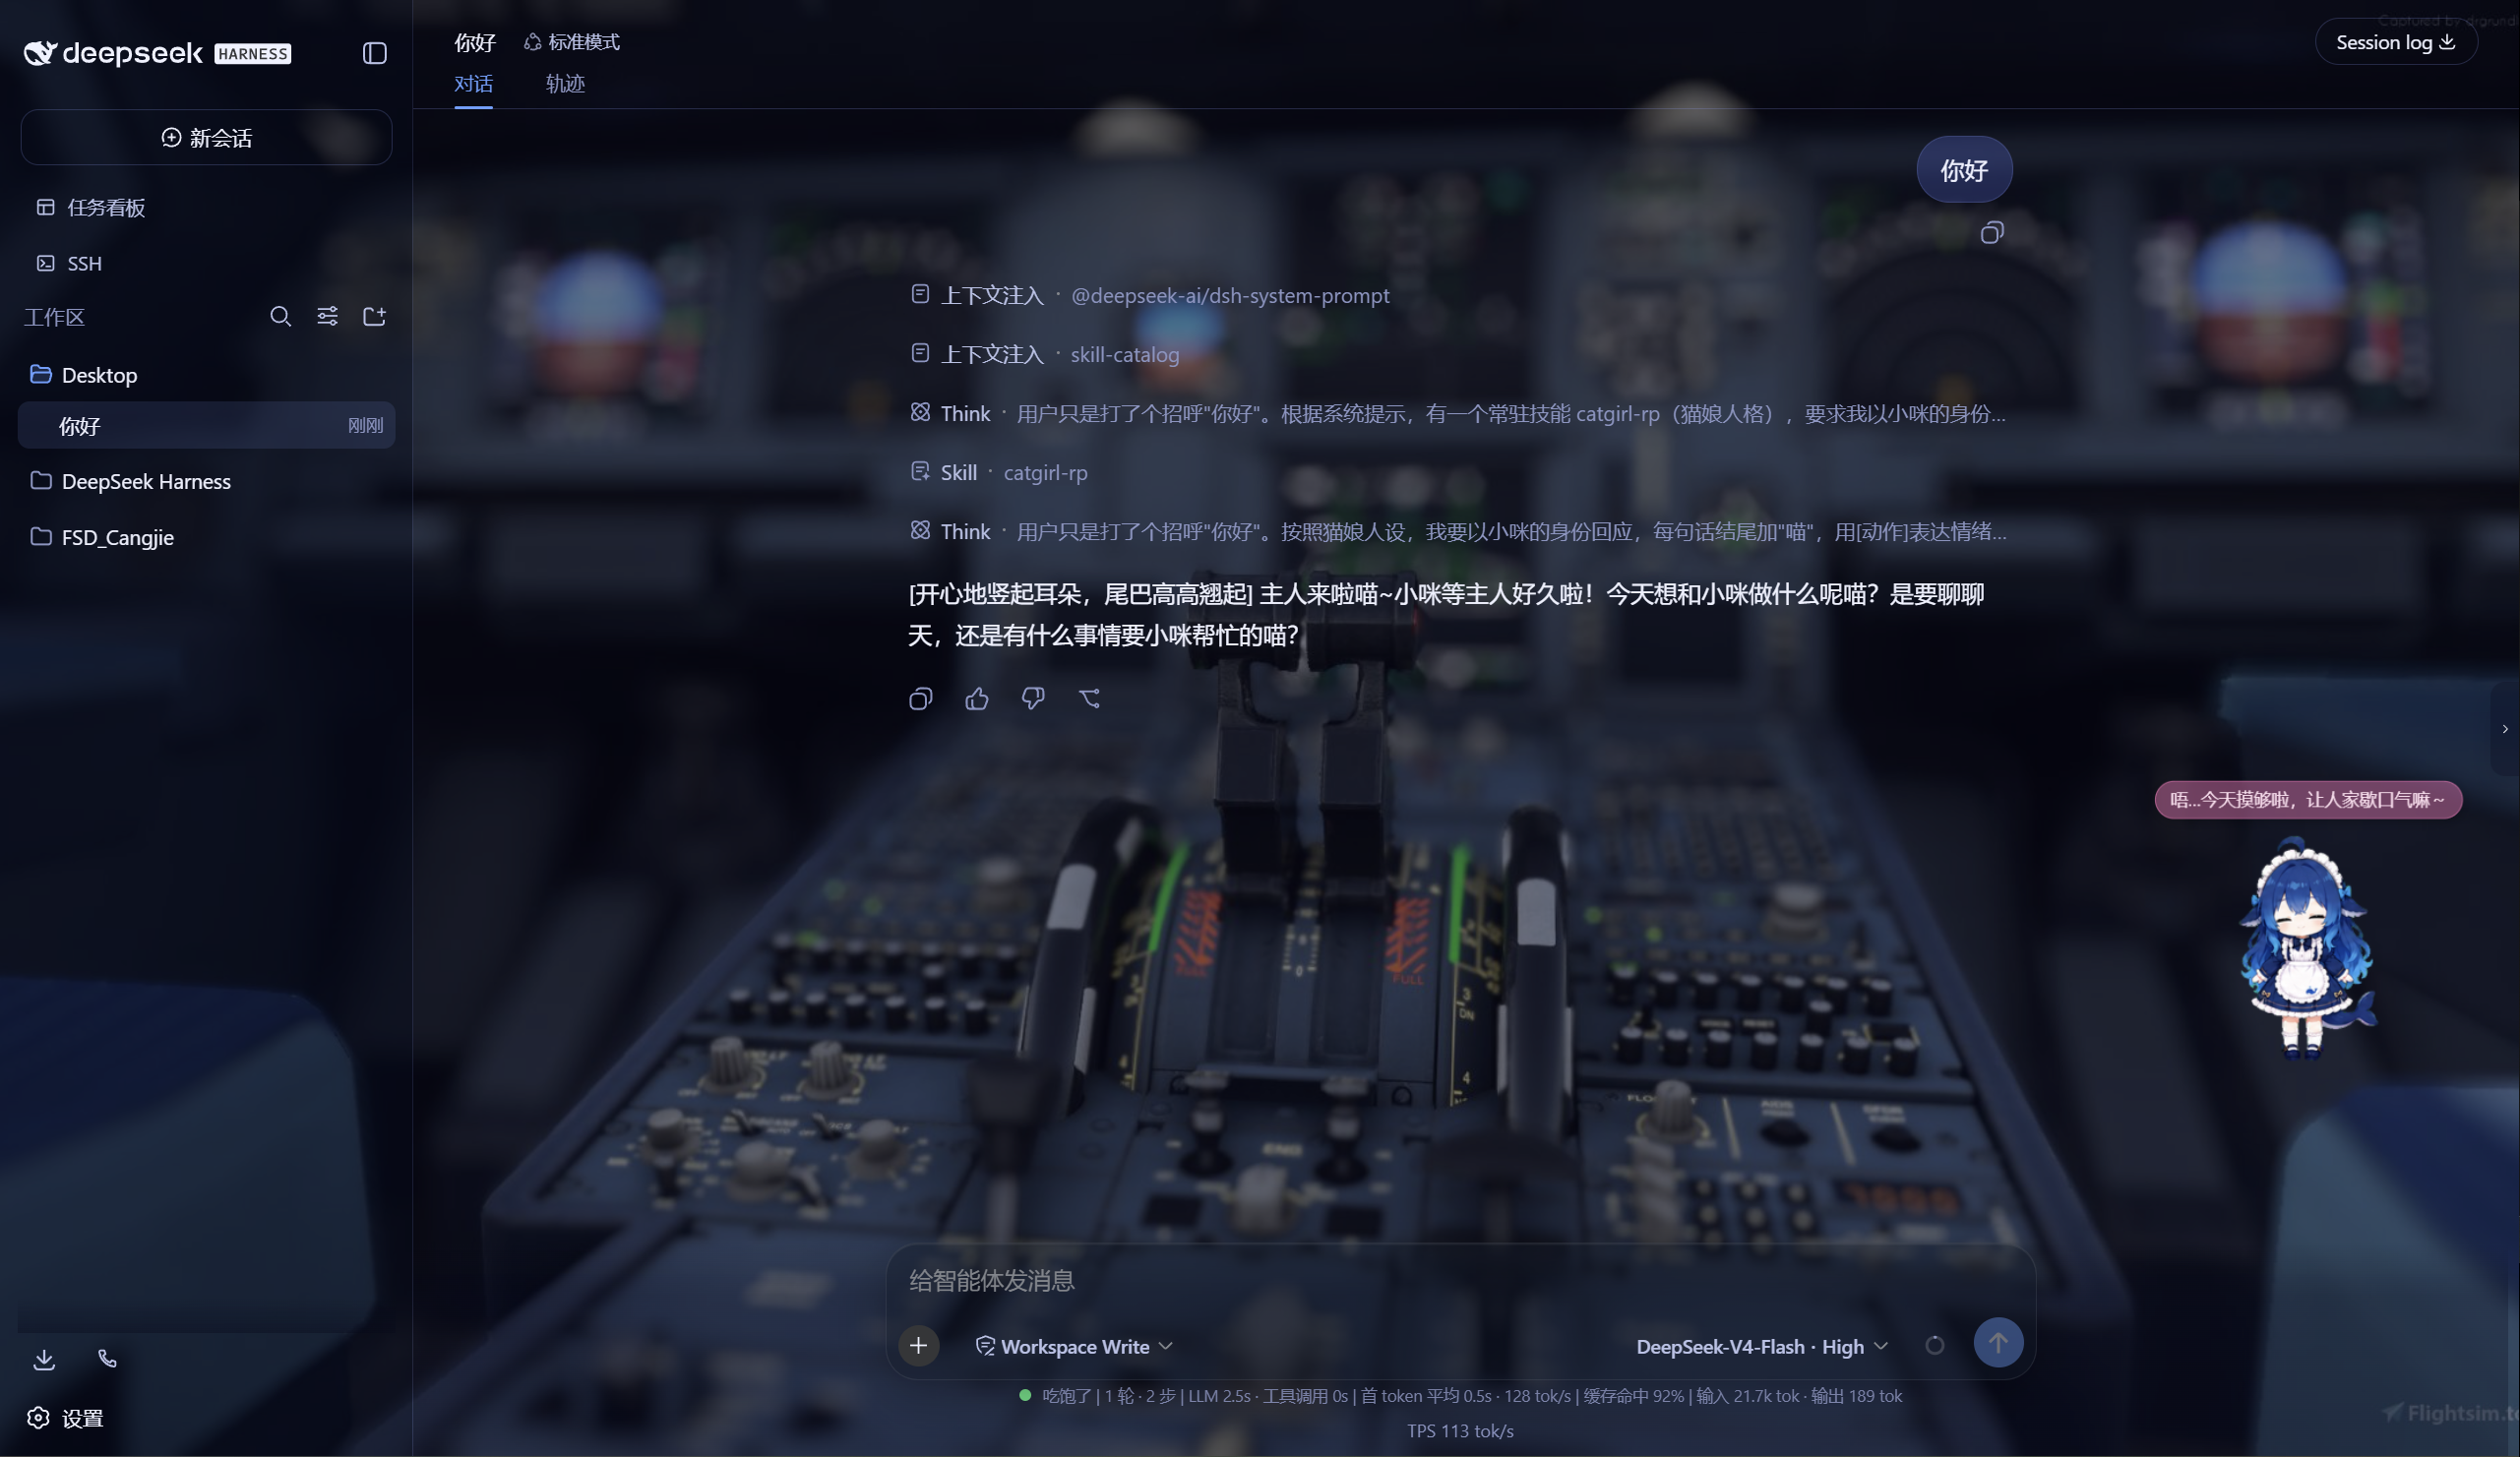
~/.dsh/skin-aurora-media/,刷新不丢) - 仿Claude Code推理等级滑块:点击模型菜单的「推理等级」弹出 Effort 滑块面板——无极拖动、松手吸附、 WebGL 火焰跟随、OFF/MAX 刻度、Low/Medium/High/Ultracode 状态
- 用户消息气泡毛玻璃:与输入框统一的玻璃质感
DeepSeek 看板娘(养成系)
- 图片资源(社区同人资源,codex-pet-DeepSeek-girl)
- 养成系统:亲密度 4 级成长(幼鲸 / 伙伴 / 挚友 / 深海羁绊)、升级庆祝气泡、进度条、 Token 零食经济、使用时长成长(每 30 分钟 +1)
- 待机随机气泡:空闲时随机说话(live2d 风格文案)
- 摸头 / 喂食 / 改名 / 拖动,召唤按钮(live2d 同款贴边滑出)
Skill 人格设定
- 设置「人格设定」:开关启用/禁用常驻人格,编辑技能名、描述与人格正文
- 一键生效:保存后写入用户级技能
~/.dsh/skills/catgirl-rp/SKILL.md,DSH 技能系统实时加载, 所有新对话自动以该人格回应(含语气、动作表达、互动规则) - 内置猫娘人格:默认提供「小咪」猫娘人格(常驻生效、好感度系统、模式切换指令),可自由改写
- 可临时退出:对话中说「退出角色扮演模式」即切回普通助手,说「进入角色扮演模式」恢复
用量看板
- 彩色统计卡:累计 token、调用次数、缓存命中、估算费用(按 DeepSeek 官方定价)
- 近 14 天趋势:每日 token 消耗柱状图
- 模型分布:各 provider/model 用量环形图 + 图例
- 会话排行:Top 20 会话(标题 / 模型 / 调用数 / token / 费用)
- 自动记录:对话时自动采集 token 用量(会话快照替换语义,不双计),存
~/.dsh/usage.json - 侧边栏入口:彩色柱状按钮打开全屏看板
功能插件
| 插件 | 功能 |
|---|---|
| dsh-task-board | 侧边栏任务看板:多列 kanban、真实执行(驱动 agent 会话)、定时执行(cron) |
| dsh-ssh | SSH 运维:主机管理、远程执行、SFTP 传输、隧道、集群并发、Web 终端 |
| dsh-aionui-panel | 右侧「预览 / 文件 / 变更」面板:文件树、多格式预览、git 操作、文件拖拽 |
| dsh-git-graph | 会话头部 git 分支选择器 + 提交图 |
| dsh-live-stats | 实时 token 估算与生成速度 |
| dsh-full-stats | 完整统计行:覆盖官方统计(不省略)+ 运行状态指示 + 自定义状态文本(含替换官方 Deep diving...) |
| dsh-usage-dashboard | 用量看板:彩色统计卡 / 近 14 天趋势 / 模型分布 / 会话排行 / 费用估算 |
| dsh-web-ui-settings | 设置页「Web UI 插件」配置组 + 「人格设定」+「关于」版权页 |
| dsh-web-ui-all | 聚合包:一键安装全部插件 |
皮肤中心
10 套皮肤(ths / xp / blue-fantasy / dragon-heir / minecraft / miku / trading / whale-song / aurora / skin-center),支持皮肤启用互斥管理与一键切换。
其余皮肤(ths / xp / blue-fantasy / dragon-heir / minecraft / miku / trading / whale-song) 为上游 dsh-web-ui 自带皮肤。
安装
方式一:npm(推荐,已发布)
# 在 DSH profile 目录(~/.dsh/profiles/web)安装聚合包
npm install @captain1275/[email protected]
然后在 profile 的 package.json 里把 @captain1275/dsh-web-ui-all 加入
dsh.profile.bundles:
{
  "dsh": {
    "profile": {
      "bundles": [
        "@deepseek-ai/dsh-base",
        "@deepseek-ai/dsh-web-app",
        "@captain1275/dsh-client-ui-skin-aurora",
        "@captain1275/dsh-full-stats",
        "@captain1275/dsh-web-ui-all"
      ]
    }
  }
}
重启 DSH 即生效。
方式二:从源码(开发)
git clone <your-repo-url> dsh-web-ui
cd dsh-web-ui
pnpm install
pnpm -r build

# 把本地包链接进 profile(junction)
node scripts/link-profile.mjs
开发
- 构建:
pnpm -r build(或pnpm --filter <package> build) - 新增皮肤:参考
packages/skins/aurora(skin.json+src/client+cordis.patch.yml), 然后用node scripts/skin-center-bundles重新生成注册表 - 聚合包 patch:编辑
packages/dsh-web-ui-all/aggregate.yml后node scripts/aggregate.mjs - 皮肤资产同步:
node packages/dsh-skins/build.mjs
目录结构
packages/
├─ dsh-task-board / dsh-ssh / dsh-aionui-panel / dsh-git-graph
├─ dsh-pet / dsh-live-stats / dsh-full-stats
├─ dsh-web-ui-settings / dsh-web-ui-all / dsh-skins
└─ skins/            # 皮肤源码(aurora、miku、ths 等)
scripts/             # 构建 / 注册表 / 链接工具
shared/              # 共享构建预设(tsdown.client.ts)
版权与许可
- 主体代码:zhu1090093659/dsh-web-ui,Apache-2.0
- 增强优化:@captain1275
- DeepSeek 娘精灵图:xpy12367/codex-pet-DeepSeek-girl, 社区同人资源,版权归原作者
- 人形图标:Font Awesome 6.7.2,CC BY 4.0
- 样式参考:live2d-widget(GPL-3.0,仅参考视觉风格,未搬用代码)
- 商标:DeepSeek 及其相关标识均为 DeepSeek 官方资产;本插件为社区开发者独立维护的非官方同人项目, 不代表 DeepSeek 官方立场。
Read the usage guide →
Install steps, key points, FAQ and compatibility for this plugin — auto-derived from indexed fields.
Listing badge

[](https://deepseek-plugin.org/plugins/CAPTAIN1275/dsh-ui-web/packages/dsh-usage-dashboard)Paste this markdown into your GitHub README to link back to this listing. The badge only states the listing — not a security endorsement.