Add a balance and usage dashboard for DSH Web: display official account balance, today's and monthly consumption, model and session cost rankings, cache savings, and bill estimation for peak-valley pricing effective 2026-08-17.

- Language
- TypeScript
- License
- MIT
- Branch
- master
Install
$ dsh plugin --profile web add @cassius0924/dsh-usage-dashboardRun the command above in your terminal to install this plugin via the dsh CLI. You can switch Profile in the top-right corner. New to dsh? Read the beginner tutorial
Install via your agent
Install the DeepSeek Harness plugin Cassius0924/dsh-usage-dashboard for me: review the repository at https://github.com/Cassius0924/dsh-usage-dashboard first, then run the install command and verify the plugin loads successfully.
Paste this instruction to the DSH Web GUI assistant — it will install and verify for you.
At a Glance
Give DSH Web a pair of "eyes": a draggable floating balance window showing remaining balance and how many days it will last based on the recent 7-day average; the session top bar gets an extra "Quota" tab displaying today/month-to-date/cumulative spending, cost rankings by model and session, how much caching has saved you, and bill estimates before/after DeepSeek's August 17, 2026 peak-valley price change—all in the GUI.
Core Features
- Account Balance & Available Days: Both the floating window and "Quota" page show real-time balance, calculating "Estimated X days remaining" based on the average daily consumption of the last 7 calendar days (including unused days); turns red when under 3 days
- Today / Month-to-Date / Cumulative Spending Overview: Today shows "vs Yesterday", month-to-date shows "vs Same Period Last Month", expandable to see the actual applied pricing—it's not a black box
- Peak-Valley Bill Estimation: DeepSeek implements two-tier peak pricing from 2026-08-17 in Beijing timezone (09:00–12:00 and 14:00–18:00); before生效, it recalculates your historical usage at the new rates so you can see the increase; after生效, it shows "how much you could save by moving peak to off-peak"
- Cache Hit Savings: Each usage record calculates the difference between "non-hit price vs cache-hit price", aggregated into "Caching saved you X CNY"; gives recovery suggestions when hit rate drops below 60%
- Model & Session Cost Rankings + Current Session Instant Consumption: Model Top N (sorted by cost descending, with input/output/cache three columns), Session Top 6 for quick identification of costly conversations; when entering any session's top "Quota" tab, it first shows "This session has spent X", with each assistant message showing its round consumption
- Usage Time Distribution & Local Visualization: Last 30 days daily bar chart, 0–23 hour hourly bar chart (multi-select models to stack as grouped bars), last 12 weeks heatmap—all support keyboard exploration and touch tap; data range / corrupted records coverage is explicitly disclosed at dashboard bottom
Technical Implementation
- Language: TypeScript (host-side ESM, client-side React 18.2 + TSX, esbuild single-file closure bundling)
- Key Dependencies:
@deepseek-ai/cordis^4.0.0 (host service discovery and plugin runtime),react^18.2.0 (client UI),@deepseek-ai/dsh-client-runtime/dsh-client-locale/dsh-client-ui-conversation(client bootstrap inject items),esbuild^0.25.0 +typescript^5.6.0 (build) - Architecture Pattern: DSH standard dual-half (bundle + client). Host half registers prefix routes
/api/dsh-usage-dashboard/{balance,usage,session}viactx.inject(['webServer','credentials','sessionPersistence']): balance calls DeepSeek official/user/balance, usage traverses all local DSH session logs, bucketsassistant/message.usageby model (read from latestrequest/header.config) × Beijing time window; 5-minute server-side memoization to avoid repeated replay. Client half triggers parallelfetchBalance/fetchUsageprefetch on load, mounting toshell.overlay(floating window),conversation.view("Quota" tab),conversation.chat.assistant-actions(message row cost) three slots; all styles use DSH's--dsw-alias-*theme variables, following host theme - Entry Files: Host-side
src/index.ts(route registration + memoization); Client-sidesrc/client/index.tsx(three slot registration + prefetch + locale registration); pricing table concentrated insrc/pricing.ts, aggregation and billing insrc/usage.ts; build outputlib/index.js+lib/client.js
Use Cases
When you're running token-intensive agent tasks with DSH and want to know "how much did I spend this month, which sessions and models contributed, how much did caching save me, how much impact will DeepSeek's August 17 price hike have"—it pulls all numbers from local session logs with estimation formulas, letting you answer in the GUI. Suitable for heavy users starting to worry about DeepSeek bills, tuning budgets, or doing cost reviews for the team.
Prerequisites & Compatibility
| Dependency | Min Version | Description |
|---|---|---|
| DeepSeek Harness (DSH) | No specific version declared | cordis.patch.yml registers one line dsh-usage-dashboard in web profile; runtime mounts to three slots provided by host: shell.overlay, conversation.view, conversation.chat.assistant-actions |
| Node.js | >=20 | package.json#engines.node = ">=20"; build target node22 |
| Platform | Cross-platform | Pure JS/TS, no native module dependencies; balance interface forced to only send to https://api.deepseek.com (official domain) |
| Native Modules | None | Only built-in modules like node:http / node:fs, no node-gyp dependencies |
| peerDependencies | @deepseek-ai/cordis ^4.0.0 / react ^18.2.0 | Provided by host web profile |
| Required Data | DEEPSEEK_API_KEY configured | Filled in DSH "Settings → Models", or written to $DSH_HOME/.credentials.yaml; when not configured, balance follows { ok:false, error: '未配置 DEEPSEEK_API_KEY' } path, dashboard other parts still display local usage |
Installation
dsh plugin --profile web add @cassius0924/dsh-usage-dashboard
After installation, you must restart dsh web: route registration happens in host process, browser refresh alone won't bring /api/dsh-usage-dashboard/* online; after startup, floating window appears at bottom-right, and when entering any session, you can click "Quota" among the three tabs Chat / Trajectory / 额度.
You can also install from GitHub checkout or local path:
dsh plugin --profile web add github:Cassius0924/dsh-usage-dashboard
dsh plugin --profile web add ./path/to/dsh-usage-dashboard
Configuration
This plugin exposes all adjustable fields in the "Settings" card at the end of the "Quota" tab, all persisted to browser localStorage (with version suffix, safe fallback to defaults when old values become invalid). Here's the human-readable field explanation:
| Config | Type | Description | Default |
|---|---|---|---|
| Balance Warning Threshold | Number (CNY) | Warning banner appears at dashboard top and floating window turns warning color when account balance falls below this value; set to 0 to disable | 10 |
| Monthly Budget | Number (CNY) | Progress based on Beijing timezone month; progress bar turns yellow at 80%, turns red above 100% with estimated month-end overspend amount; set to 0 to disable budget | 0 |
| Statistics Period | 7 / 30 / 90 / 365 days (single select) | Data window for usage trends, model rankings, session rankings, cache and peak-valley cards in "Quota" tab; switching doesn't clear the 30-day overview cache | 30 |
| Chart Metrics | tokens / cost / calls (single select) | Primary axis display for bar charts and heatmaps; switching reveals different perspectives on the same window | tokens |
| Floating Window Toggle | Switch | After closing, floating window no longer appears at bottom-right (enabled by default) | true |
| Floating Window Visible Tabs | Tab ID multi-select | Determines which session tabs the expanded floating window can appear under—for example, if you only want it under "Chat", check it here; when newly installing a plugin, won't auto-check if previously hand-modified | All tabs |
Built-in port, pricing table, cache TTL (balance 60 seconds, usage 5 minutes), memoization reset and other behavioral parameters are not in user configuration; see comments at top of src/usage.ts, src/pricing.ts, src/index.ts for details.
FAQ
Q: After installation, I can't see the "Quota" tab. What should I do?
A: The "Quota" tab is attached to individual session top bar (not the New Session homepage). Open any existing session first, then refresh to see the three tabs Chat / Trajectory / 额度; the floating window at bottom-right is not subject to this limitation—it appears on any page.
Q: Balance is incorrect or shows "未配置 DEEPSEEK_API_KEY"?
A: Balance uses the official https://api.deepseek.com/user/balance endpoint, relying on the DeepSeek API Key already configured in DSH. Please fill in the Key in DSH "Settings → Models" (or put it in $DSH_HOME/.credentials.yaml as DEEPSEEK_API_KEY), then restart dsh web to pull the balance; the endpoint is hard-bound to the official domain, balance requests will be rejected when using a custom baseURL.
Q: Why does the displayed "cost" not match the DeepSeek official bill?
A: This is an estimate, not billing reference. All rules are concentrated in src/pricing.ts: pricing is calculated per usage record based on "model + whether it falls in Beijing timezone peak window (09:00–12:00, 14:00–18:00)"; usage before 2026-08-17 uses old fixed rates, after uses peak-valley two-tier (off-peak is half of peak). Unrecognized models estimate at the higher deepseek-v4-pro side, conservatively not underestimating. Platform discounts, gift credit consumption order and other invisible items are not included—refer to official bill.
Q: First time opening the dashboard takes a long time?
A: "Usage" requires traversing all local DSH session logs for aggregation, about 5 seconds in local testing. Two things are done to avoid repeated replay: server memoizes the result for 5 minutes; client triggers balance and usage prefetch in parallel on load, by the time user actually clicks the tab, data is likely already prefetched into cache, first screen renders immediately. Skeleton placeholders show instead of empty text when there's no data. Click the top-right "↻" refresh button to see latest numbers immediately (with ?refresh=1 to bypass memoization).
Q: This shows local data—will multiple devices/accounts be counted together?
A: No. The coverage card (dashboard bottom) explicitly states the data range is "DSH session logs on current device", excluding other devices, DeepSeek platform direct calls, or deleted local logs. It simultaneously shows how many sessions were scanned, how many corrupted records were skipped, earliest/recentest valid record timestamps, allowing users to calibrate their understanding of this estimate.
Q: How do I adjust the balance warning threshold? When does it trigger?
A: Change the warning threshold in the "Settings" card at the end of "Quota" tab, default ¥10, set to 0 to disable. When breached, a warning banner appears at dashboard top with "Can sustain X days + Go to recharge", floating window dot and balance number simultaneously turn warning color; after threshold is changed, both sides' alert status sync, no inconsistency.
Q: When monthly budget reaches 100%, will it automatically stop model calls?
A: No, this plugin's budget and overspend warnings are only reminders, not blockers. Progress bar turns yellow at ≥80%, turns red at ≥100% and dashboard shows estimated month-end overspend at current rate. For hard limits, please handle at the model layer.
Q: What should I watch out for when uninstalling?
A: After dsh plugin --profile web remove @cassius0924/dsh-usage-dashboard, just restart dsh web, routes and services are all revoked. Plugin writes no files, spawns no background processes; the only residual is preferences and cache in browser localStorage prefixed with dsh-usage-dashboard:pref: / dsh-usage-dashboard:balance / :usage, manually clear if needed, or they'll reappear on next reinstall.
Q: If I modify the built-in pricing table, can it keep up with DeepSeek price changes?
A: When DeepSeek changes prices, just modify the two tables in src/pricing.ts (LEGACY_RATES and PEAK_RATES, per pro/flash two tiers × cache hit/miss/output three columns). This plugin has no "one-click fetch official pricing page" feature; after manual maintenance, run pnpm run build to take effect.
Getting Started
Beginner — one line dsh plugin --profile web add @cassius0924/dsh-usage-dashboard plus restart dsh web, after restart zero configuration needed to see floating window and "Quota" tab.
Known Issues & Limitations
- Data range limited to local: Coverage card explicitly states dashboard statistics only cover "DSH session logs on current device", excluding other devices, DeepSeek platform direct calls, or deleted local logs
- Cost is estimate: Excludes DeepSeek platform discounts, gift credit consumption order and other invisible items;口径不完全一致 with official bill; peak-valley periods are judged by Beijing timezone, not by browser timezone
- First cold start replays all session logs: Server memoizes result for 5 minutes to avoid replay on every tab switch, forced refresh still possible (
?refresh=1/ floating window ↻) - Unrecognized models estimated at higher deepseek-v4-pro side: Deliberately conservative, interface simultaneously shows "Unknown model priced as deepseek-v4-pro" (src/pricing.ts:47 / src/client/locales.ts:55)
- Single interface口径: Balance only trusts DeepSeek official domain (
api.deepseek.com), balance request returns error when pointing to non-official domain, won't redirect or fallback for misconfiguration - Client preferences and cache in browser localStorage (with version suffix): Not synced across devices; silently degrades in private mode / quota exhausted (no error), user may experience "suddenly forgot settings"
- Floating window "click to jump to Quota tab" capability: DSH public client API doesn't expose view switch entry, avoids fragile binding via DOM text clicking; currently positions via drag/collapse to corners, main entry still "Quota" tab in session top bar (TODO.md:9-10)
- Must restart
dsh webafter install/update to take effect: Route registration happens at host process startup, browser refresh alone won't bring/api/dsh-usage-dashboard/*online


在 DSH(DeepSeek Harness)的 Web GUI 里,随时看得见 DeepSeek 的钱花在哪: 余额还能撑几天、今天花了多少、哪个模型最贵、缓存替你省了多少,以及 2026-08-17 峰谷定价之后账单会变成什么样。
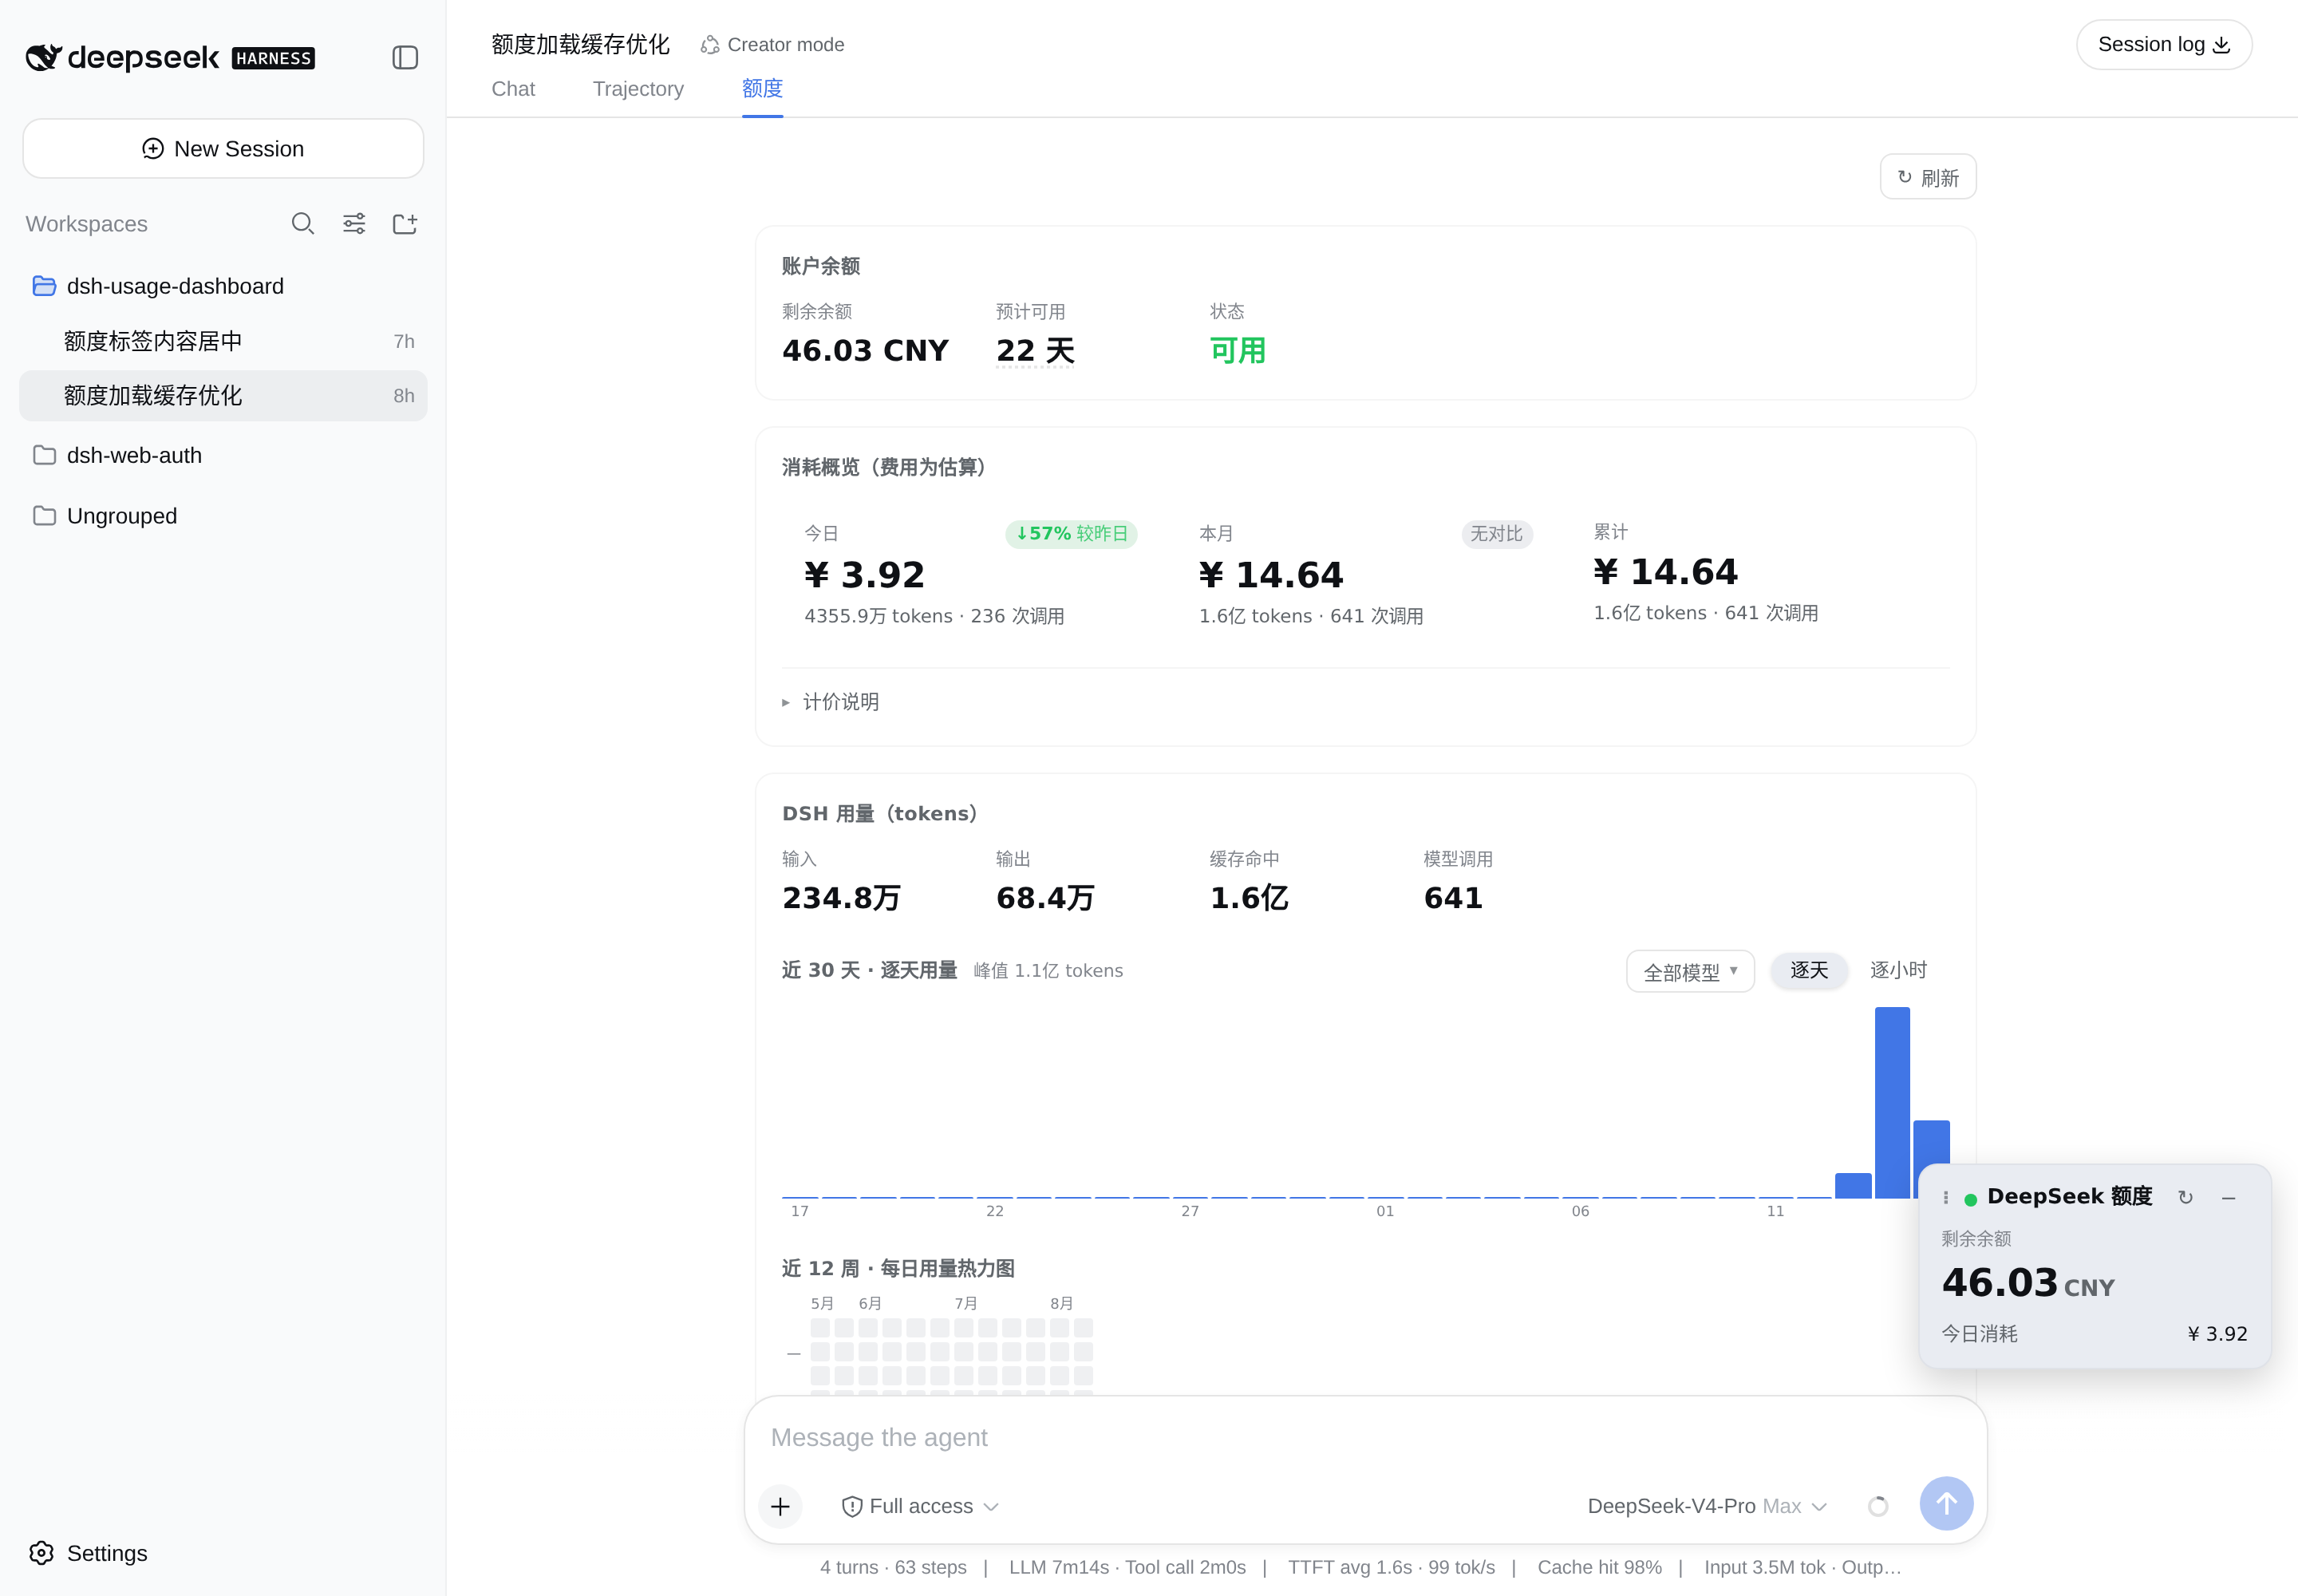
装上之后 GUI 里多两样东西:右下角一个可拖动的悬浮额度窗,顶部栏多一个**「额度」tab**。 界面支持中文与 English,直接跟随 DSH 全局的「Settings → Language」设置;切换无需刷新,选择由 DSH 持久化。
为什么需要它
用 DSH 跑 agent,钱是一点一点漏掉的,而 DSH 自己不会告诉你:
| 你真正想知道的 | 装之前 |
|---|---|
| 余额还能用几天? | 只有一个余额数字 |
| 今天花了多少?这个月呢? | 只有「累计」,没有时间感 |
| 钱花在哪个模型上? | 不知道 |
| 缓存到底帮我省了多少? | 完全看不到 |
| 8-17 涨价后我的账单会变成多少? | 只能自己算 |
这个插件把这些问题逐个翻译成一眼能看懂的数字。费用全部为估算,算法与单价公开可查(见费用是怎么算的)。
悬浮额度窗
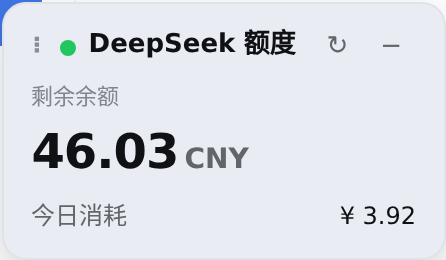
常驻右下角,不打断你干活:
- 余额 + 今日消耗,一眼就够。
- 可拖动,松手自动吸附四角;边界避开侧边栏、右侧详情面板、会话顶栏和输入框——不会挡住发送按钮。
- 可收起成一行;显示/隐藏、所在角落、收起状态都会记住,刷新页面后原样回来。
- 余额跌破预警线时,状态点和余额数字一起转成警示色。
- 60 秒自动刷新余额。今日消耗读共享缓存,点 ↻ 同时刷新两者。
- 插件加载时就把余额和用量预取到缓存里,所以打开「额度」tab 通常是秒开, 不用等那几秒的会话日志重放;预取失败不报错,交给各自挂载时再取。
「额度」仪表盘
余额:还能撑几天

「还剩多少钱」不解决余额焦虑,「还能用几天」才行。按近 7 个自然日(含没用的日子)的日均消耗折算,hover 能看到估算口径;不足 3 天转红。
今日 / 本月花了多少 —— 以及这个数怎么来的
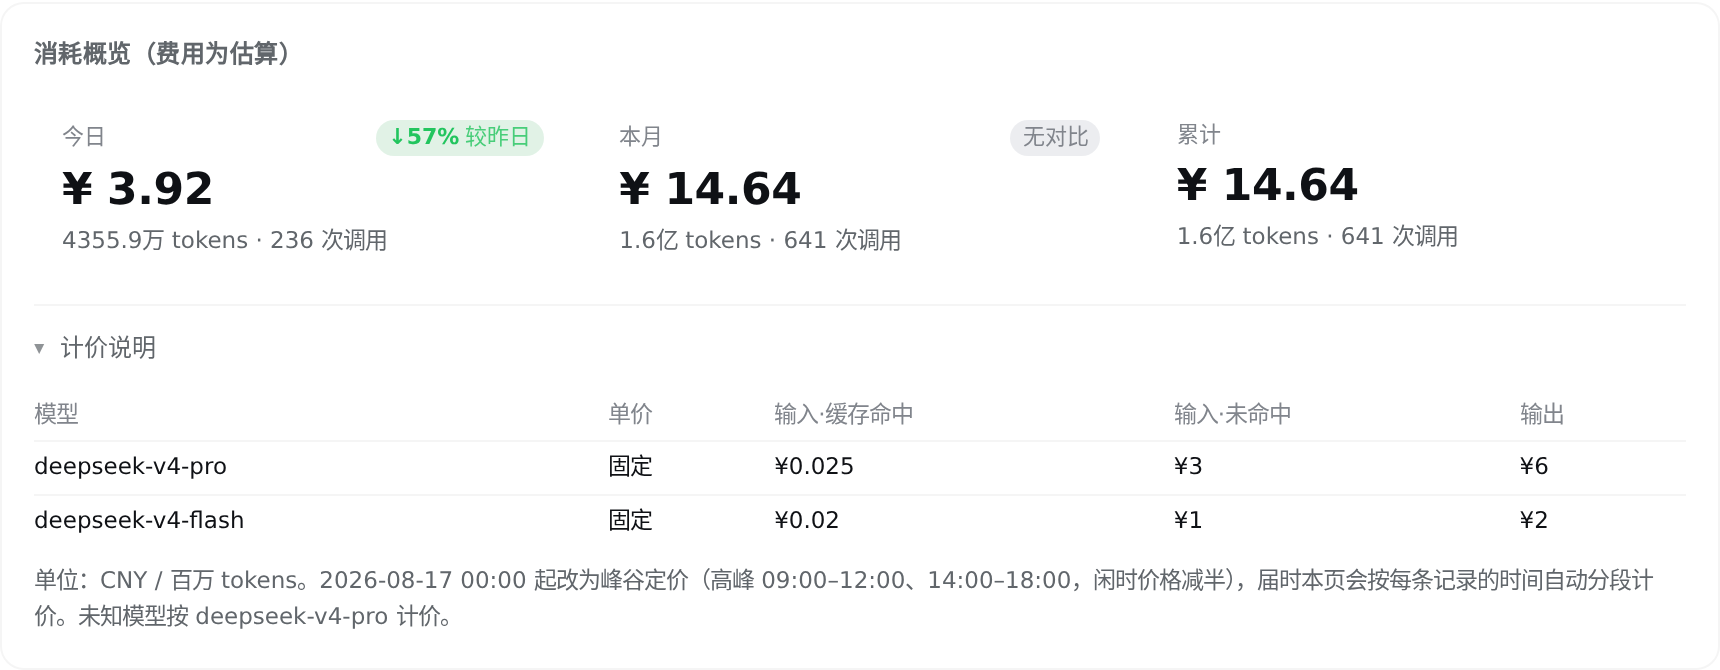
今日、本月、累计三个窗口,今日带「较昨日」、本月带「较上月同期」环比(上月同期而不是上月整月,免得月初总是显得便宜)。
展开计价说明能看到费用估算实际套用的单价表——估算不该是个黑箱。
涨价之后会变成多少
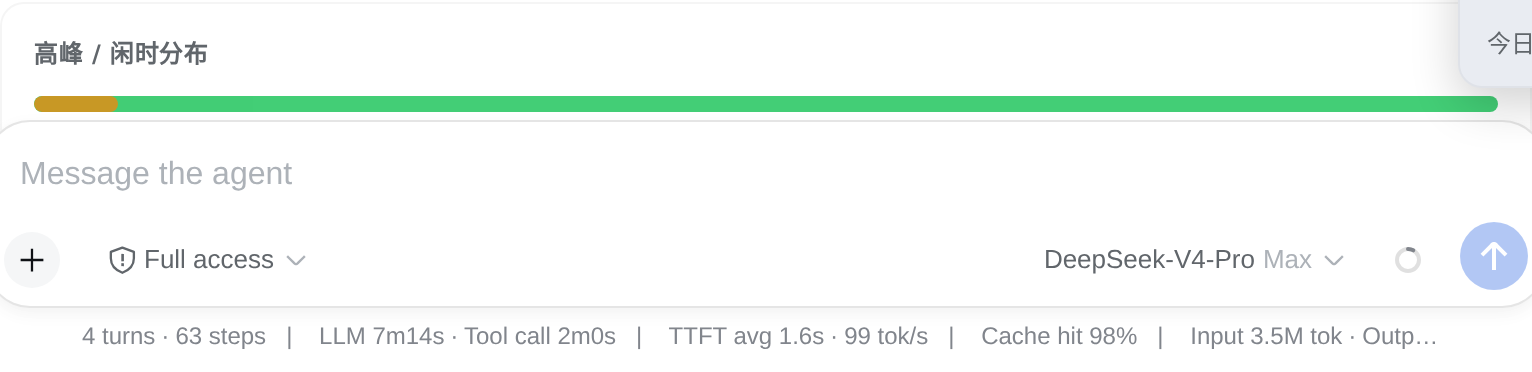
DeepSeek 从 2026-08-17 00:00 起改峰谷定价,高峰(北京时间 09:00–12:00、14:00–18:00)价格是闲时的两倍。
这张卡告诉你用量落在峰谷两侧的比例,并且在新价生效前就把账单重算一遍:上图这份用量现价 ¥14.64,新价下是 ¥45.84(+213%)。生效之后,这里会换成「把高峰用量挪到闲时能省多少」。
缓存替你省了多少
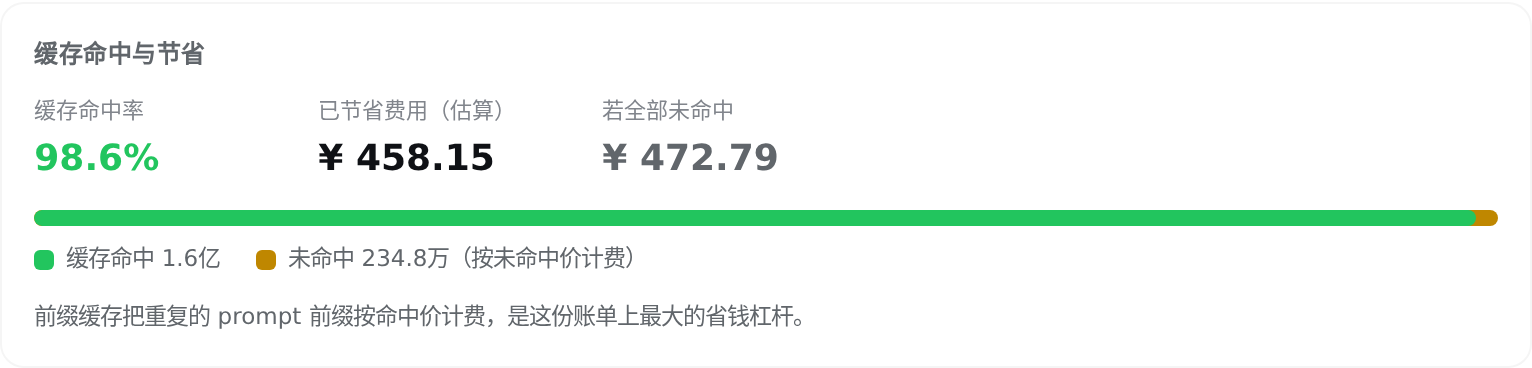
前缀缓存的命中价只有未命中价的百分之一量级,是 DSH 这类高重复 prompt 负载上最大的省钱杠杆——上图这份用量实付 ¥14.64,缓存省下了 ¥458.15。
命中率掉到 60% 以下时,文案会换成怎么把它救回来的建议。
钱花在哪个模型上
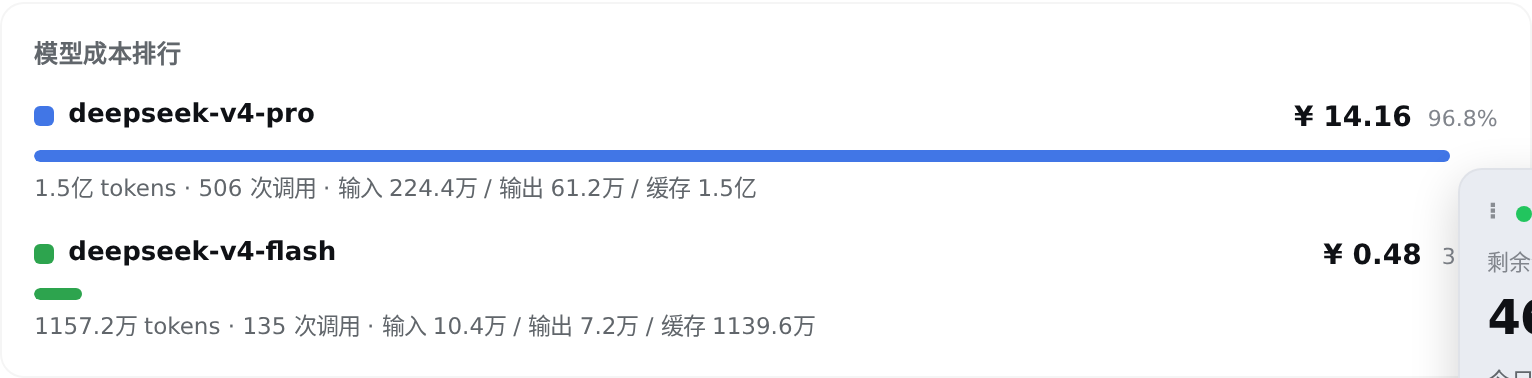
按费用降序,带占比条和输入/输出/缓存拆分。模型配色在排行、下拉选择器和图表图例三处一致。
哪个会话最烧钱
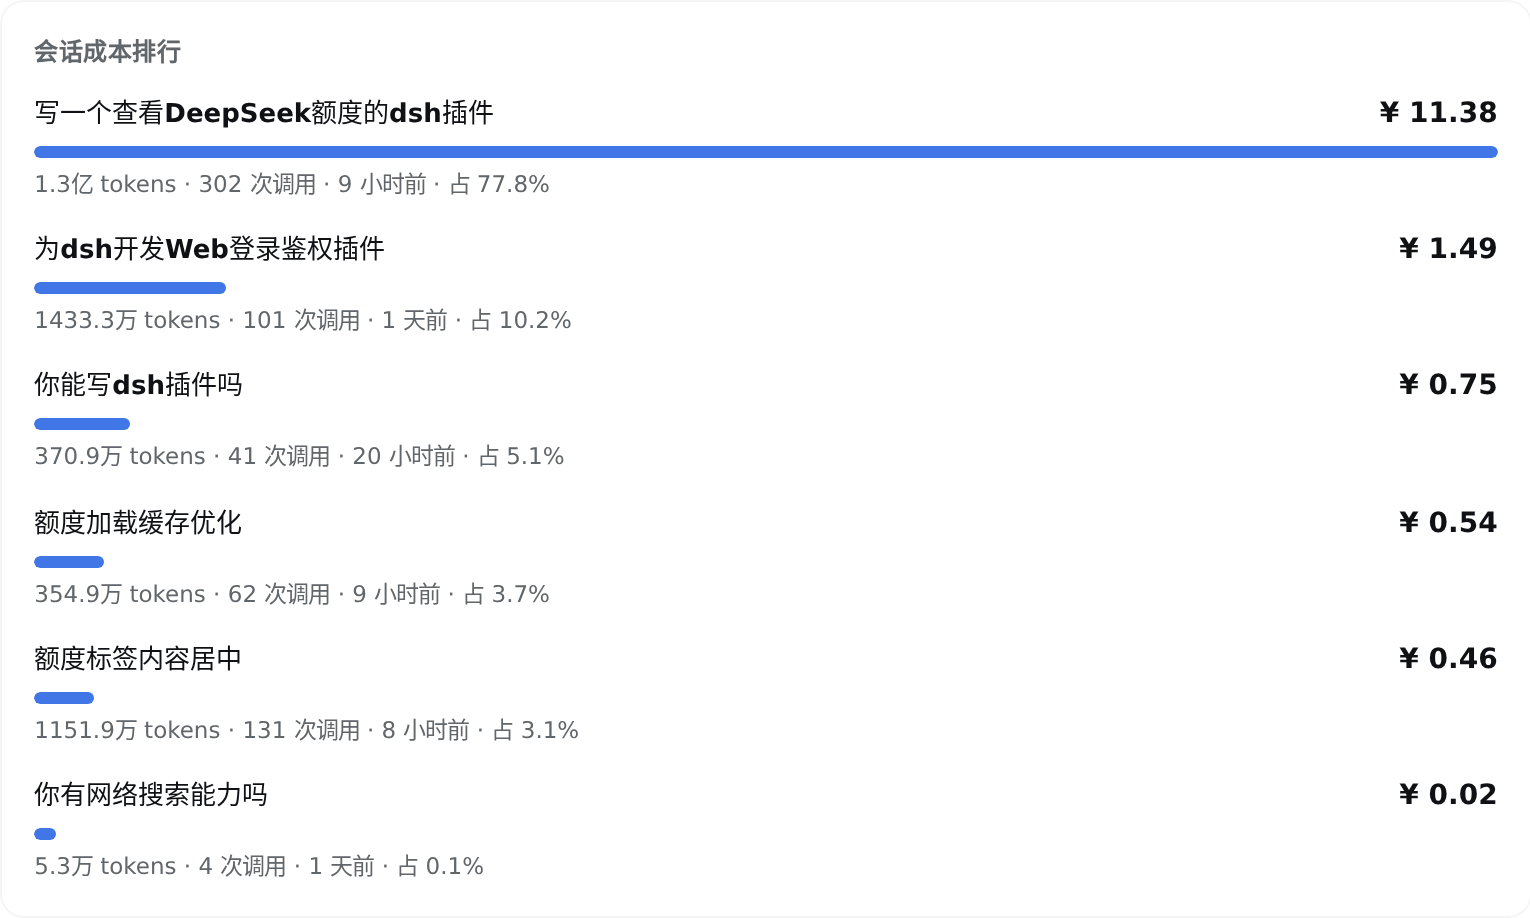
按模型、按天的视图告诉你「花在什么上」和「什么时候花的」;这张告诉你是哪一次跑掉的——对 agent 用户来说,这是唯一能直接动手改的东西:一个特别贵的会话,通常意味着一段值得看看的 prompt 或一个没收住的循环。上图里一个会话就占了总花费的 77.8%。
会话标题直接从会话日志里读(session/title 事件),跟用量重放搭同一趟车,不额外读盘。
用量的时间分布

近 30 天逐天、0–23 点逐小时(可按模型多选过滤,叠成分组柱状图),外加近 12 周热力图。hover 立刻出 tooltip,不用等系统那一秒。
余额预警

在「设置」里定一条预警线(默认 ¥10,填 0 关闭)。跌破时仪表盘顶部出现警示条——带上还能撑几天和充值入口——同时悬浮窗一起转警示色,两边不会各说各话:

安装
标准 DSH 插件包(bundle + client 双面包),用 dsh plugin 装:
# 从 npm 安装
dsh plugin --profile web add @cassius0924/dsh-usage-dashboard

# 或从 GitHub(git 依赖会跑 prepare 脚本现场构建)
dsh plugin --profile web add github:Cassius0924/dsh-usage-dashboard

# 或本地 checkout
dsh plugin --profile web add ./path/to/dsh-usage-dashboard
然后重启 dsh(dsh --profile web)生效。
前提:
- 已配置
DEEPSEEK_API_KEY(「设置 → 模型」里填,或放在$DSH_HOME/.credentials.yaml)——余额接口要用。 - 本机有 pnpm(
dsh plugin是 pnpm 的转发器)。
装好后打开 GUI,进入任意一个会话(「额度」tab 挂在 conversation.view 上,New Session 首页没有 tab 栏),顶部就能看到 Chat / Trajectory / 额度。
费用是怎么算的
费用是估算,不是账单。规则都在 src/pricing.ts 一个文件里:
- 逐条用量记录按「模型 + 是否落在高峰时段」计价,而不是全局一套价。
- 2026-08-17 00:00(北京时间)之前的记录按旧的固定价;之后按峰谷价,闲时为高峰的一半。
- 高峰时段按北京时间判定,不随机器时区漂移。
- 未识别的模型按
deepseek-v4-pro(较贵的一侧)计价。
单价(CNY / 百万 tokens):
| 模型 | 时段 | 输入·缓存命中 | 输入·未命中 | 输出 |
|---|---|---|---|---|
| deepseek-v4-pro | 08-17 前固定 | 0.025 | 3 | 6 |
| deepseek-v4-pro | 高峰 / 闲时 | 0.3 / 0.15 | 9 / 4.5 | 27 / 13.5 |
| deepseek-v4-flash | 08-17 前固定 | 0.02 | 1 | 2 |
| deepseek-v4-flash | 高峰 / 闲时 | 0.1 / 0.05 | 3 / 1.5 | 9 / 4.5 |
DeepSeek 再调价时,只改这张表。
开发 / 构建
pnpm install
pnpm test           # Node 内置测试运行器:计价、缓存、信任围栏与用量聚合
pnpm run build      # esbuild 出 lib/index.js(host)+ lib/client.js(client),再 tsc 出类型
pnpm run typecheck
产物:
lib/index.js—— Host 半(ESM,Node),注册/api/dsh-usage-dashboard/*路由。lib/client.js—— Client 半(CJS 闭包),通过window.__ModuleLoader__注册进 web 启动图。
改动生效方式不同:只改 src/client/** 时,浏览器硬刷新(Ctrl/Cmd+Shift+R)即可;改了 src/index.ts 等 host 端要重启 dsh。
src/
├── index.ts        # Host 半入口(webServer 路由 + TTL 记忆化)
├── usage.ts        # 余额 + 用量聚合(按天/小时/模型/峰谷分桶)
├── pricing.ts      # 价目表与费用估算(唯一改价的地方)
├── contract.ts     # host ↔ client 的 wire 类型
├── trust-fence.ts  # 浏览器信任校验
└── client/
    ├── index.tsx   # Client 半入口(slots 注册)
    ├── widget.tsx  # 悬浮额度窗
    ├── dashboard.tsx # 「额度」tab
    ├── charts.tsx  # 柱状图 / 热力图 / tooltip
    ├── locales.ts  # 中英文完整词典
    ├── i18n.tsx    # DSH locale 桥接与翻译上下文
    ├── styles.ts   # 全部样式
    ├── api.ts      # fetch + 客户端缓存
    ├── cache.ts    # TTL 缓存(含 localStorage 持久化)
    ├── prefs.ts    # 用户设置持久化
    └── store.ts    # 两个界面共享的设置
样式全部走 DSH 自己的 --dsw-alias-* CSS 变量,跟随宿主主题,不引入独立配色。
已知限制
- 用量数据来自本机 DSH 会话日志,不含其它机器/账户的用量。
- 费用是估算:不含 DeepSeek 侧的折扣、赠金消耗顺序等因素,以官方账单为准。
- 首次加载用量需要重放全部会话日志(本机实测约 5 秒),因此有 5 分钟的服务端记忆化;界面在此期间显示骨架屏。
License
Read the usage guide →
Install steps, key points, FAQ and compatibility for this plugin — auto-derived from indexed fields.
Listing badge

[](https://deepseek-plugin.org/plugins/Cassius0924/dsh-usage-dashboard)Paste this markdown into your GitHub README to link back to this listing. The badge only states the listing — not a security endorsement.